Campaigns Management - Full Guide
The Campaigns section is the operational core of TheOptimizer — your unified ads manager for every connected ad network. Everything you would normally do inside Facebook Ads Manager, TikTok Ads, Taboola, or any other native dashboard can be done here, across all your ad accounts, at the same time.
This guide walks through every part of the Campaigns view from top to bottom: navigation, filtering, the main campaign table, actions, column customisation, and the campaign Details view.
In This Article
- Top Navigation
- Filtering campaigns, ad sets, ads
- Manage Campaigns
- Campaign Details View
- Column Settings
- Exporting Data
1. Top Navigation
Ad Networks & Ad Accounts Filtering
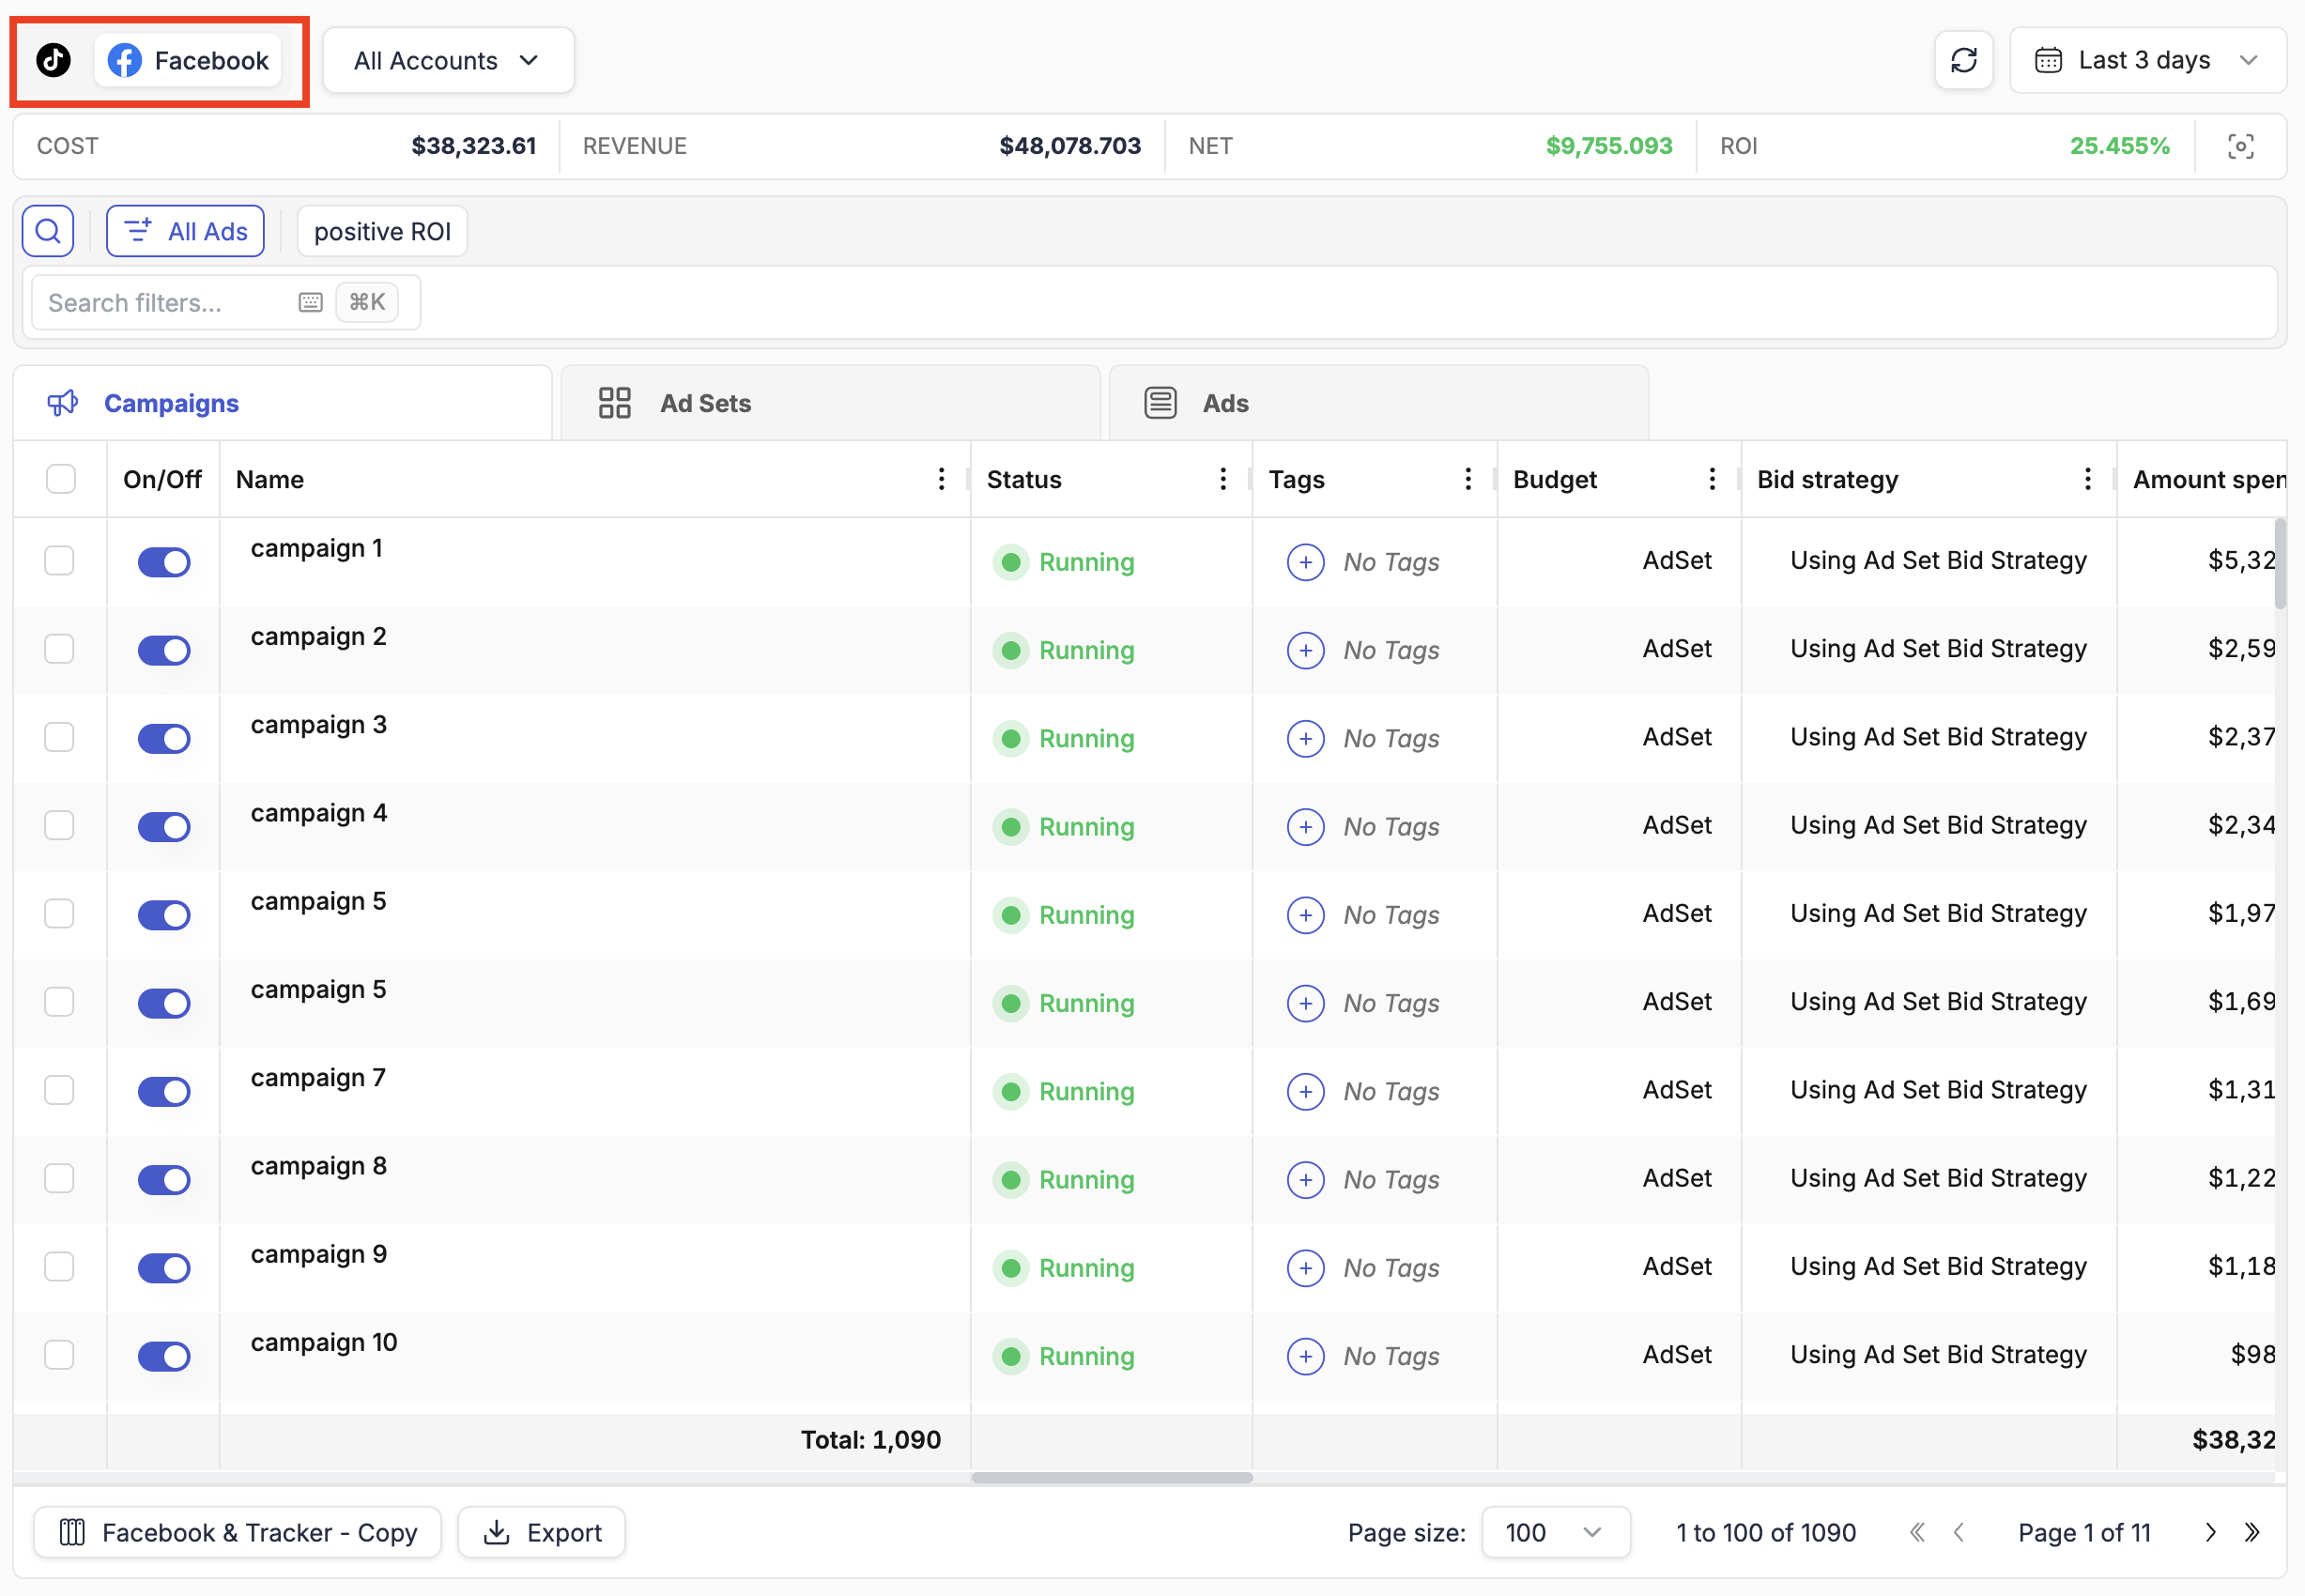
At the very top of the Campaigns view you will find the ad network navigation bar. Every ad network you have connected to TheOptimizer appears here as an icon. Clicking an icon switches the entire campaigns view to that ad network — showing only campaigns, ad sets, and ads that belong to it.
💡 Tip: If you do not see an ad network icon here, it has not been connected yet. Go to Integrations to add it.
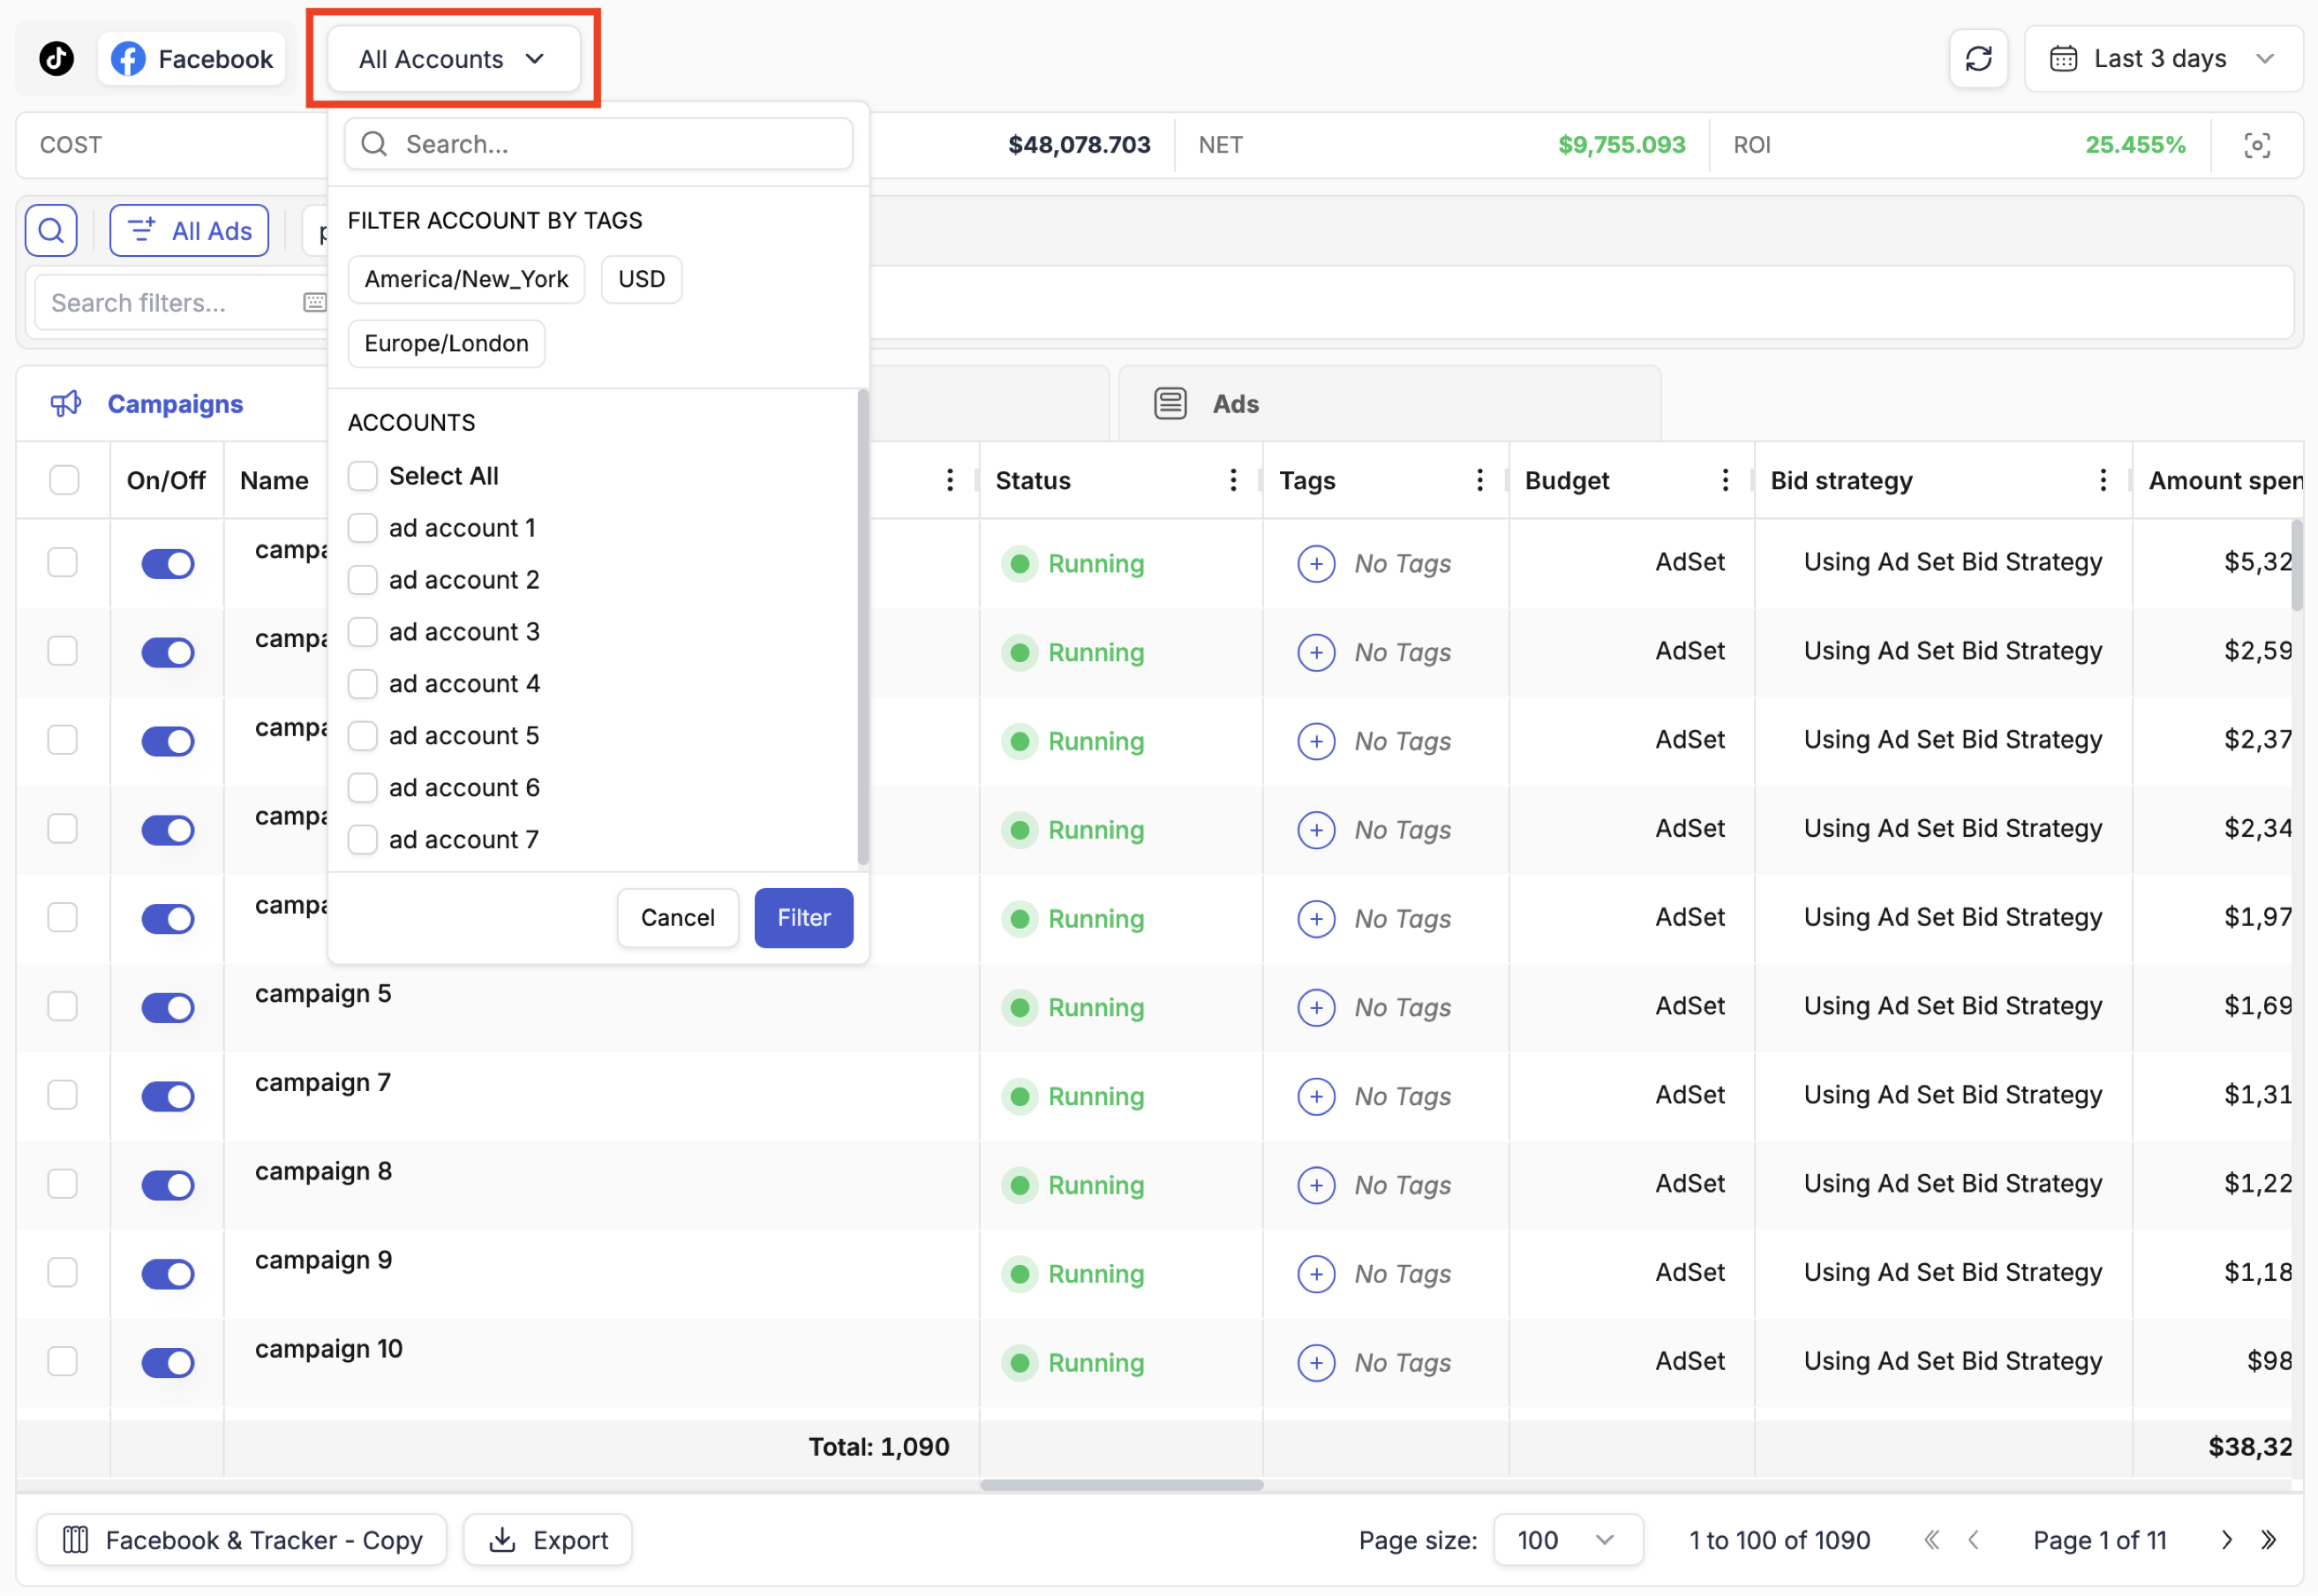
Directly to the right of the ad network icons is the Ad Accounts filter. This is one of the most powerful aspects of TheOptimizer compared to native ad managers: instead of being locked to a single ad account at a time, you can view and manage campaigns across all your accounts simultaneously — or narrow down to exactly the accounts you need.
Filtering by Tags
TheOptimizer automatically assigns tags to every ad account when it is connected. Out of the box you get:
- Timezone tag — the time zone configured on that ad account (e.g.,
UTC,America/Los_Angeles) - Currency tag — the currency of the account (e.g.,
USD,EUR,GBP)
These default tags let you instantly filter to, for example, all USD accounts or all accounts running on Eastern time. You can also add your own custom tags from Integrations → Ad Network → Ad Accounts to create groupings that match your team's structure, GEO focus, or offer verticals.
Searching for Specific Accounts
Inside the ad account filter you can type to search for specific accounts by name. Select one or more accounts and click Filter to narrow the campaigns view to only those accounts.
ℹ️ Note: The ad accounts filter and the filtering bar (Section 5) work together. Your selected ad accounts act as a persistent scope — all other filters and data apply only within those accounts.
Totals
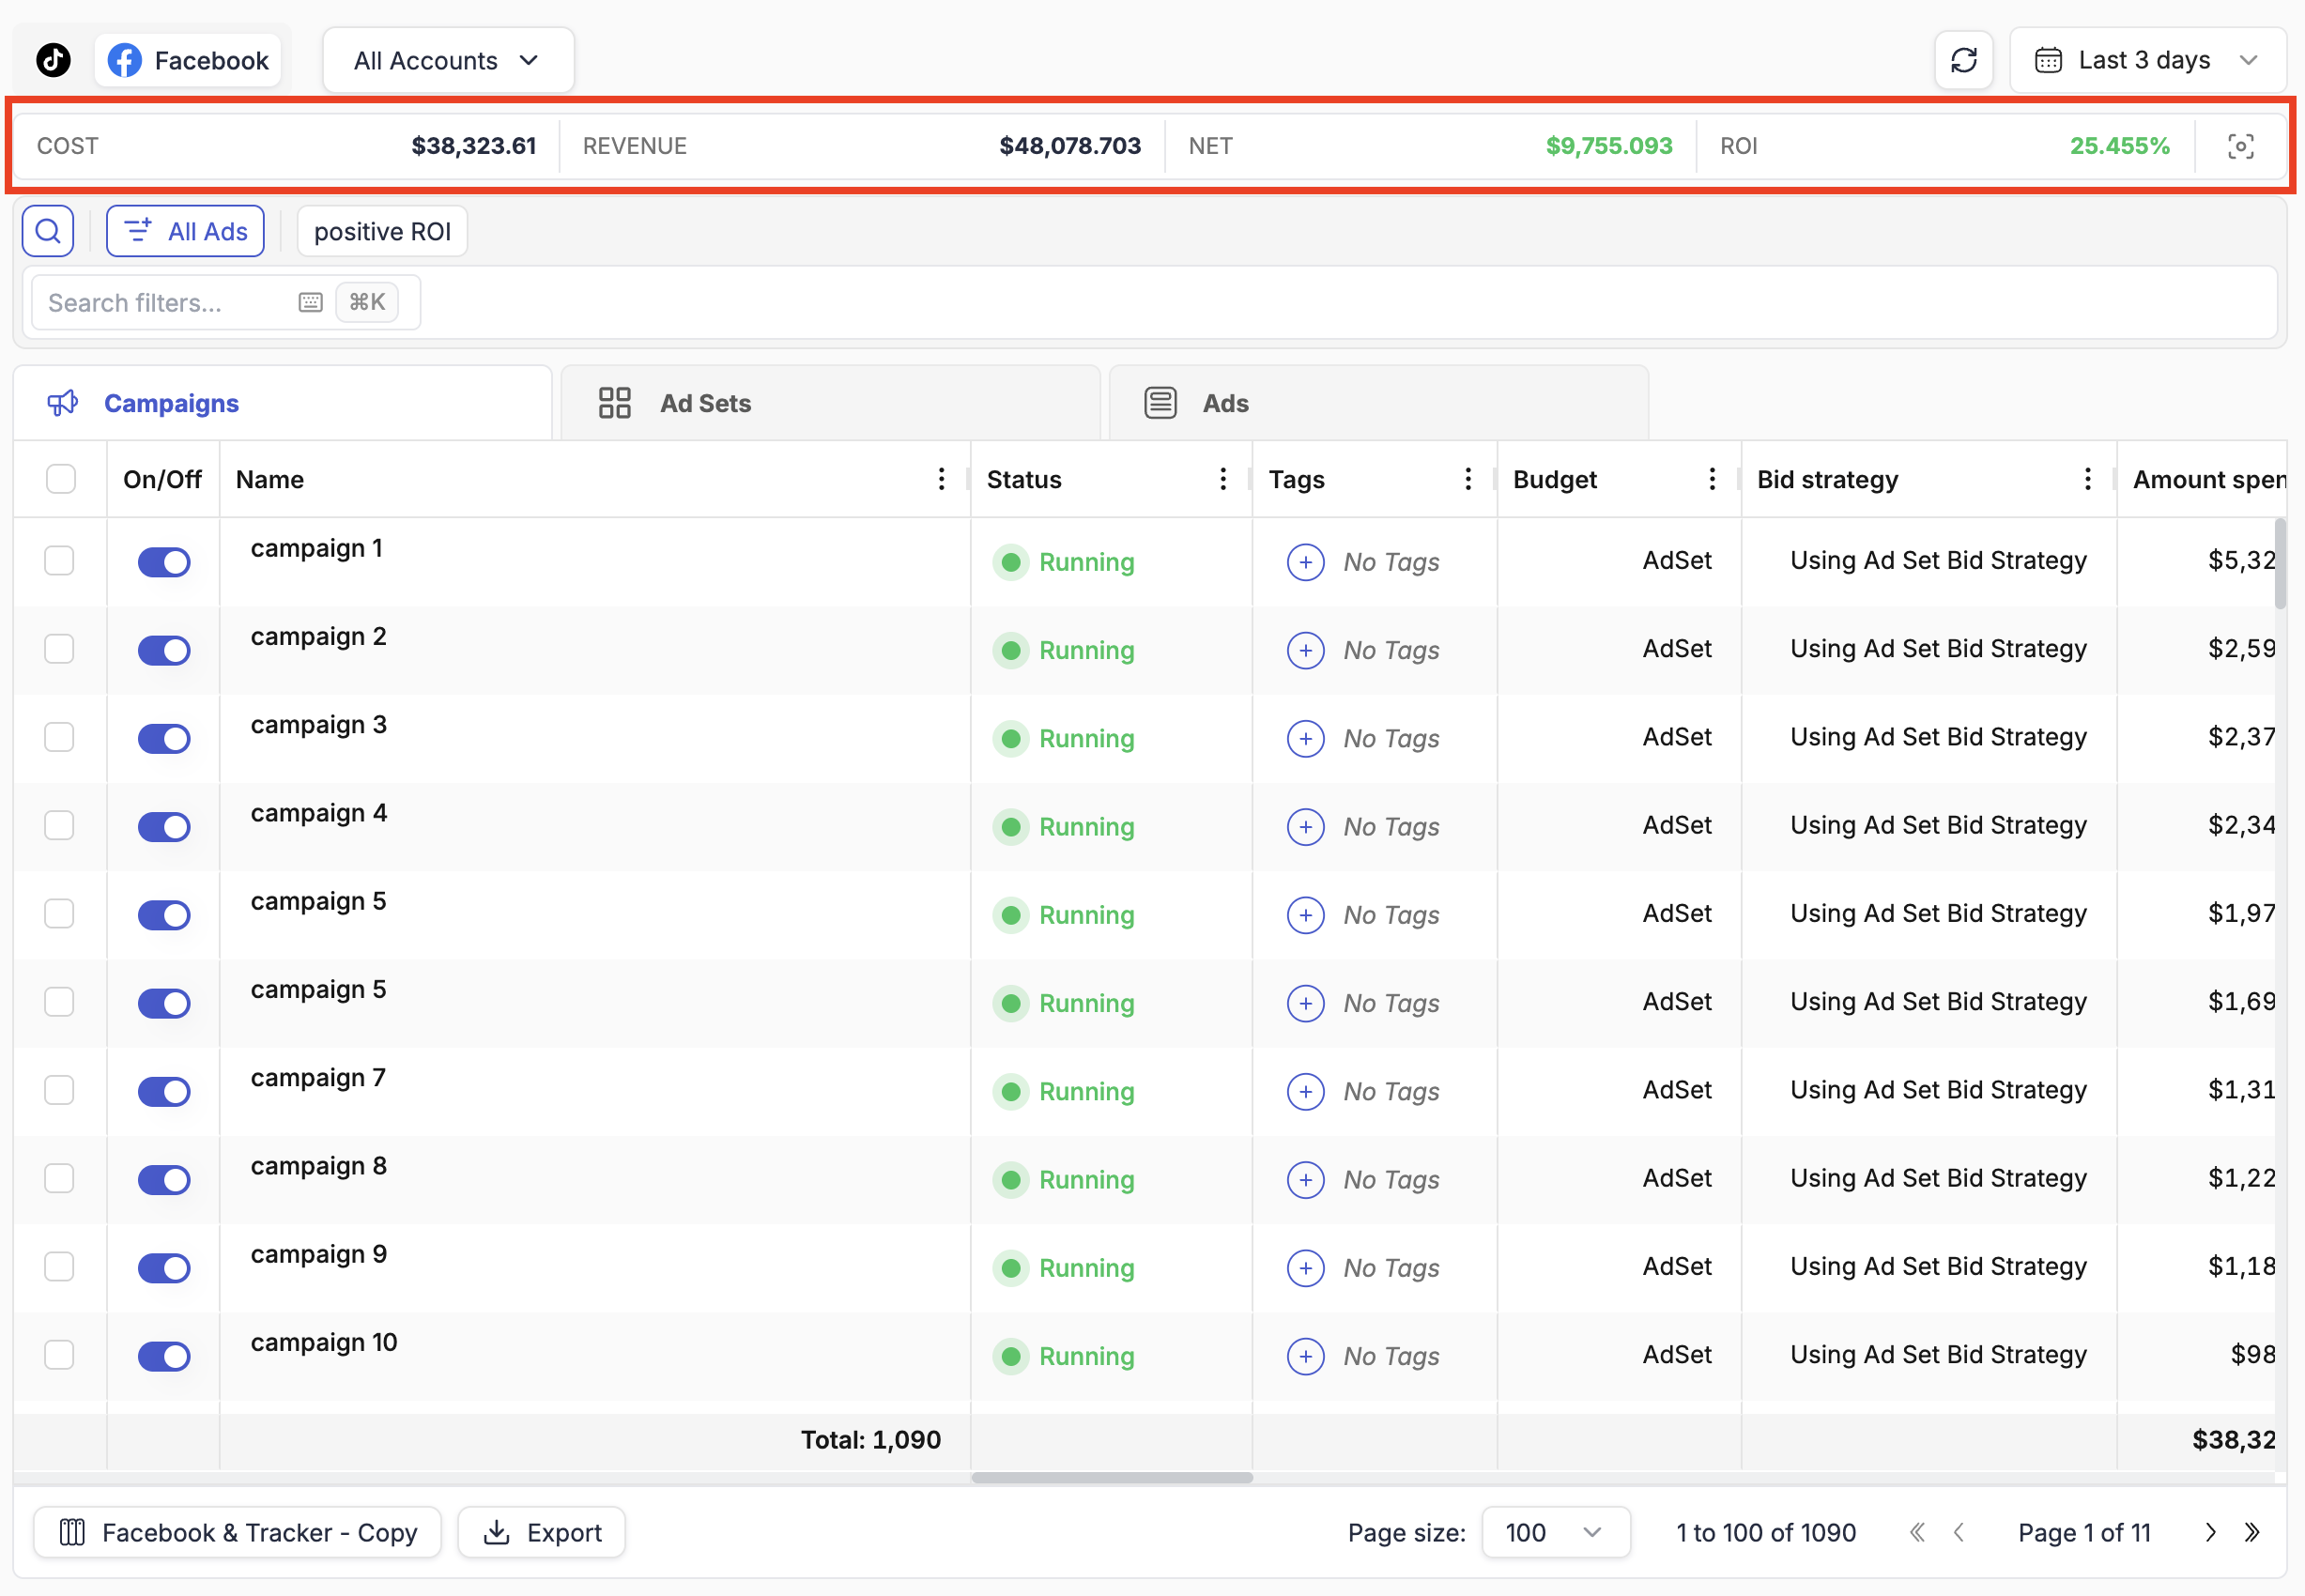
Directly below the navigation bar is the Totals Bar, which displays aggregated metrics across all currently visible campaigns:
| Metric | What it shows |
|---|---|
| Cost | Total amount spent across selected accounts and date range |
| Revenue | Total revenue (from ad network or tracker — see below) |
| NET | Revenue minus Cost |
| ROI | Return on investment as a percentage |
Currency Handling
If all your ad accounts for a given network use the same currency, that currency symbol appears next to the cost figure. If you have accounts in multiple currencies (e.g., USD and EUR), TheOptimizer does not perform automatic currency conversion. Instead:
- The total shows the raw sum of all currency values added together
- An asterisk (
*) symbol replaces the currency sign - Hovering over the asterisk shows a tooltip explaining that multiple currencies are present
⚠️ Important: If you operate accounts in multiple currencies, treat the Totals Bar as a directional indicator rather than an exact financial figure. For precise reporting, filter down to accounts sharing a single currency.
Revenue Source: Ad Network vs. Tracker
TheOptimizer pulls revenue from two potential sources: the ad network itself (if it passes revenue data) and your connected tracking platform. You can choose which one to display.
This setting is controlled from the Dashboard view — there is a switch that toggles between Ad Network Revenue and Tracker Revenue. Whichever option is active on the Dashboard also determines what the Campaigns Totals Bar shows.
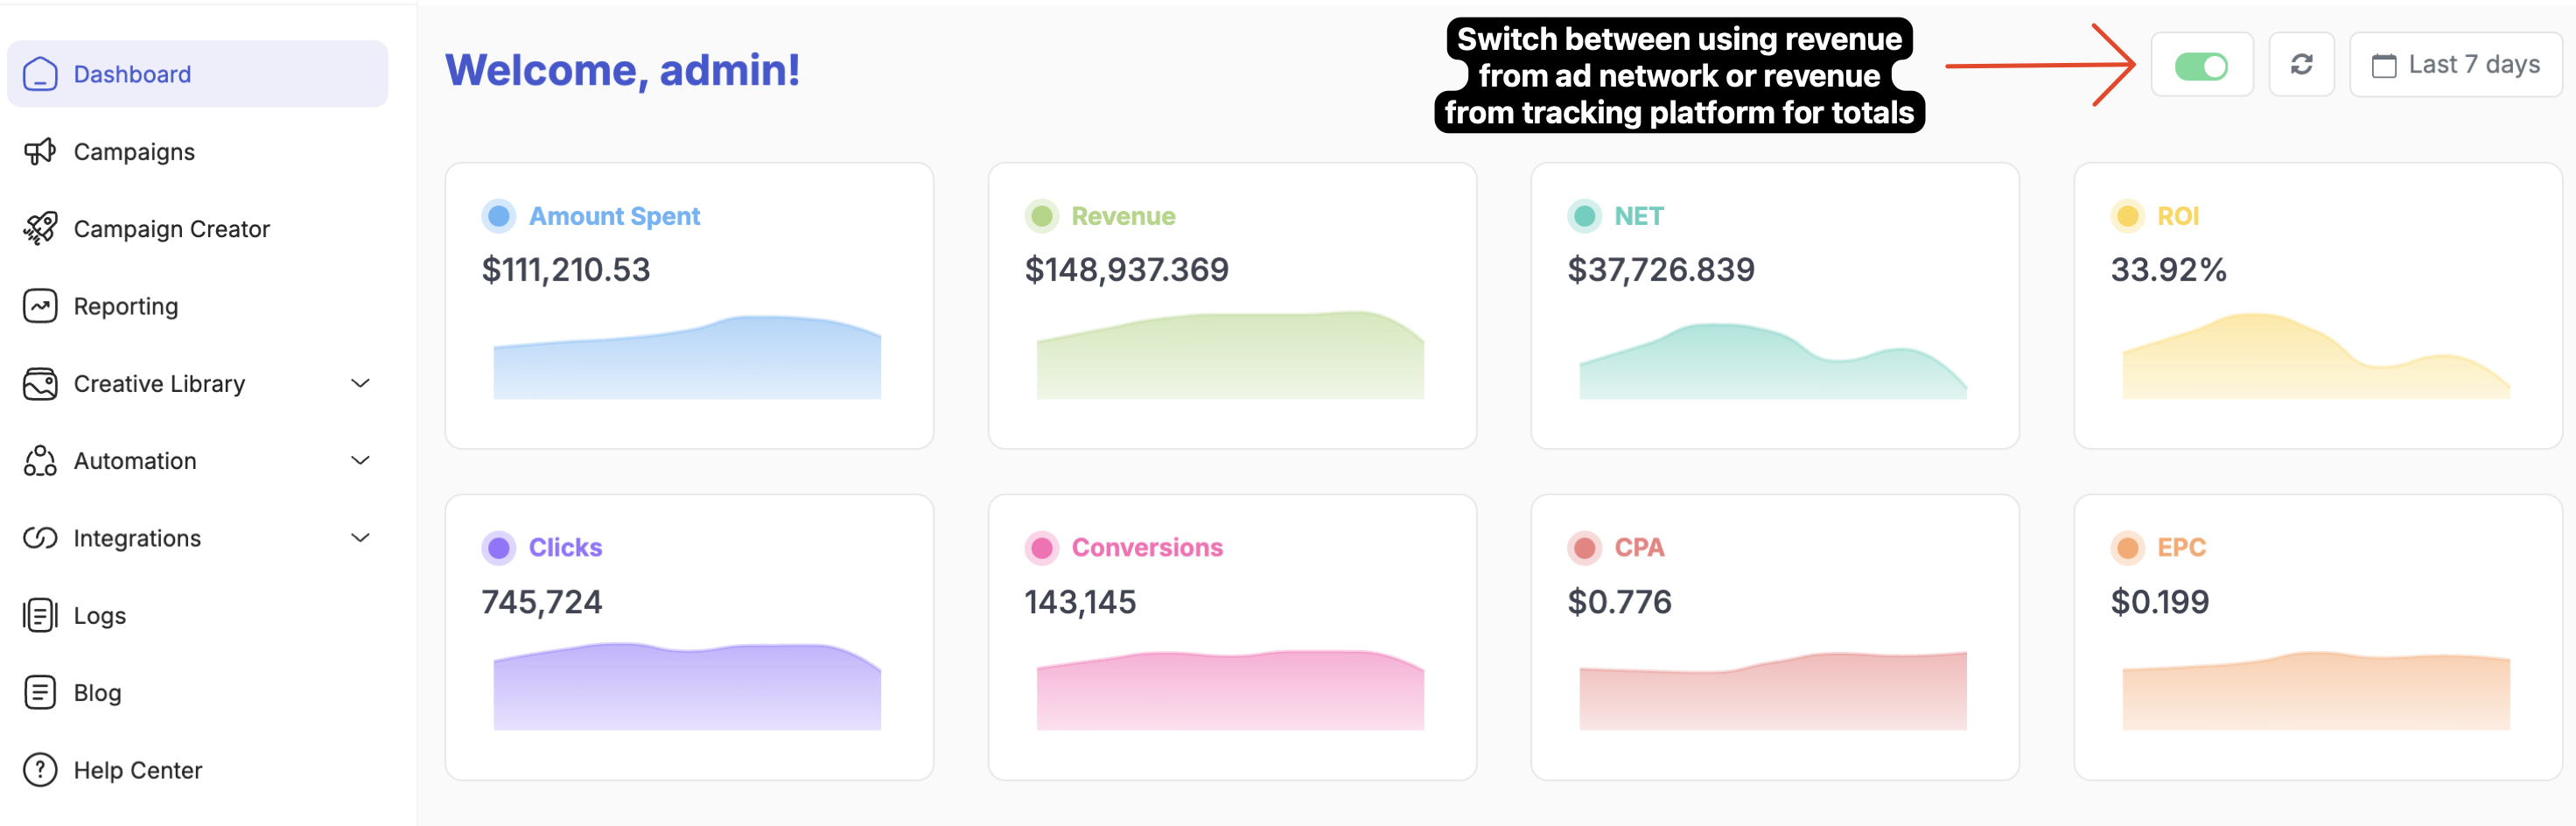
💡 Tip: If you see $0.00 in the Revenue column despite having active campaigns, the most likely cause is that you have the Ad Network Revenue option selected but are not pushing revenue data to the traffic source. Switch to Tracker Revenue on the Dashboard and the correct figures will appear across the board.
Date Ranges & Range Comparisons
The date picker is located in the top-right corner of the navigation bar. Click it to change the reporting interval for the entire view.
Available presets include: Today, Yesterday, Last 3 / 7 / 14 / 30 days, Last 90 days, This month, Last month, and Last 6 months. You can also select a fully custom date range using the calendar.
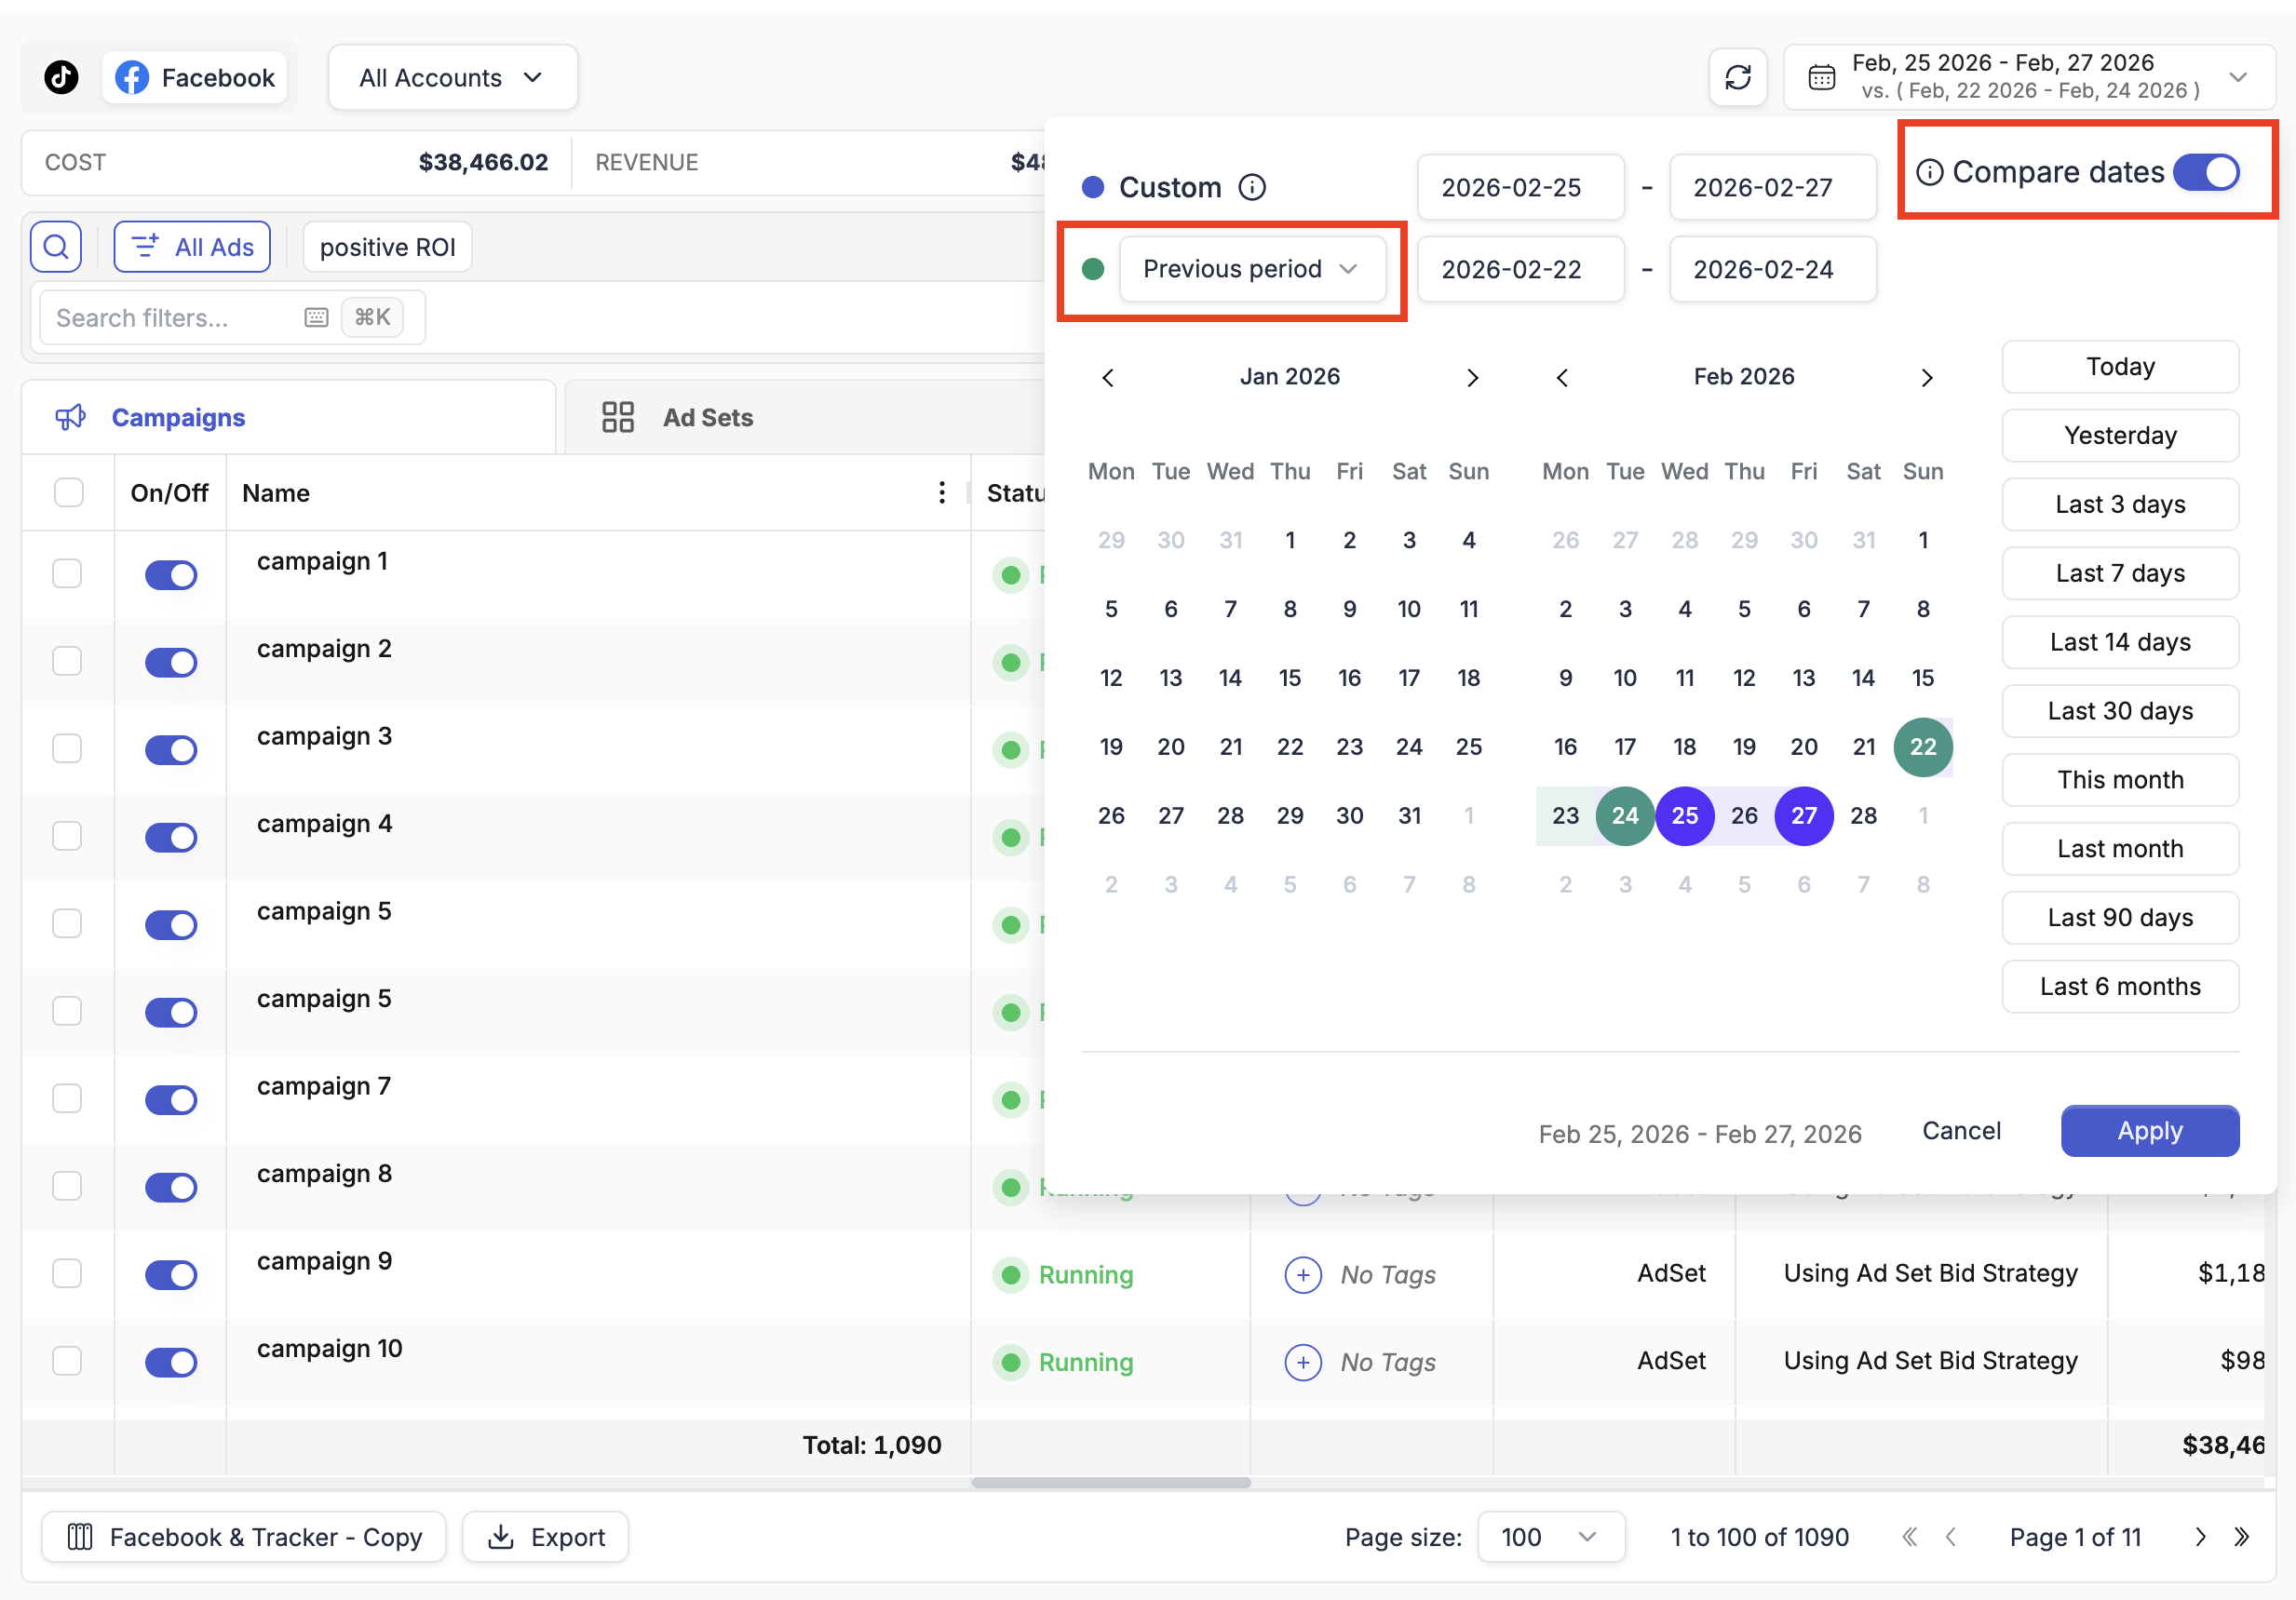
Compare Dates
Inside the date picker there is a Compare dates toggle. When enabled, you can select a second date range to compare against the primary one. The comparison data appears as additional columns in the main table for every metric you have designated as a compare column (see Compare Columns).
💡 Tip: Use Compare Dates to spot performance shifts between periods — for example, comparing this week to last week to see whether a recent creative or budget change had a measurable impact.
2. Filtering
The filtering bar sits below the Totals Bar and is one of the most flexible parts of the Campaigns view. It lets you search and filter campaigns, ad sets, or ads by virtually any metric or attribute — and save those filters as one-click views.
Click the Search filters... box to open the filter panel.
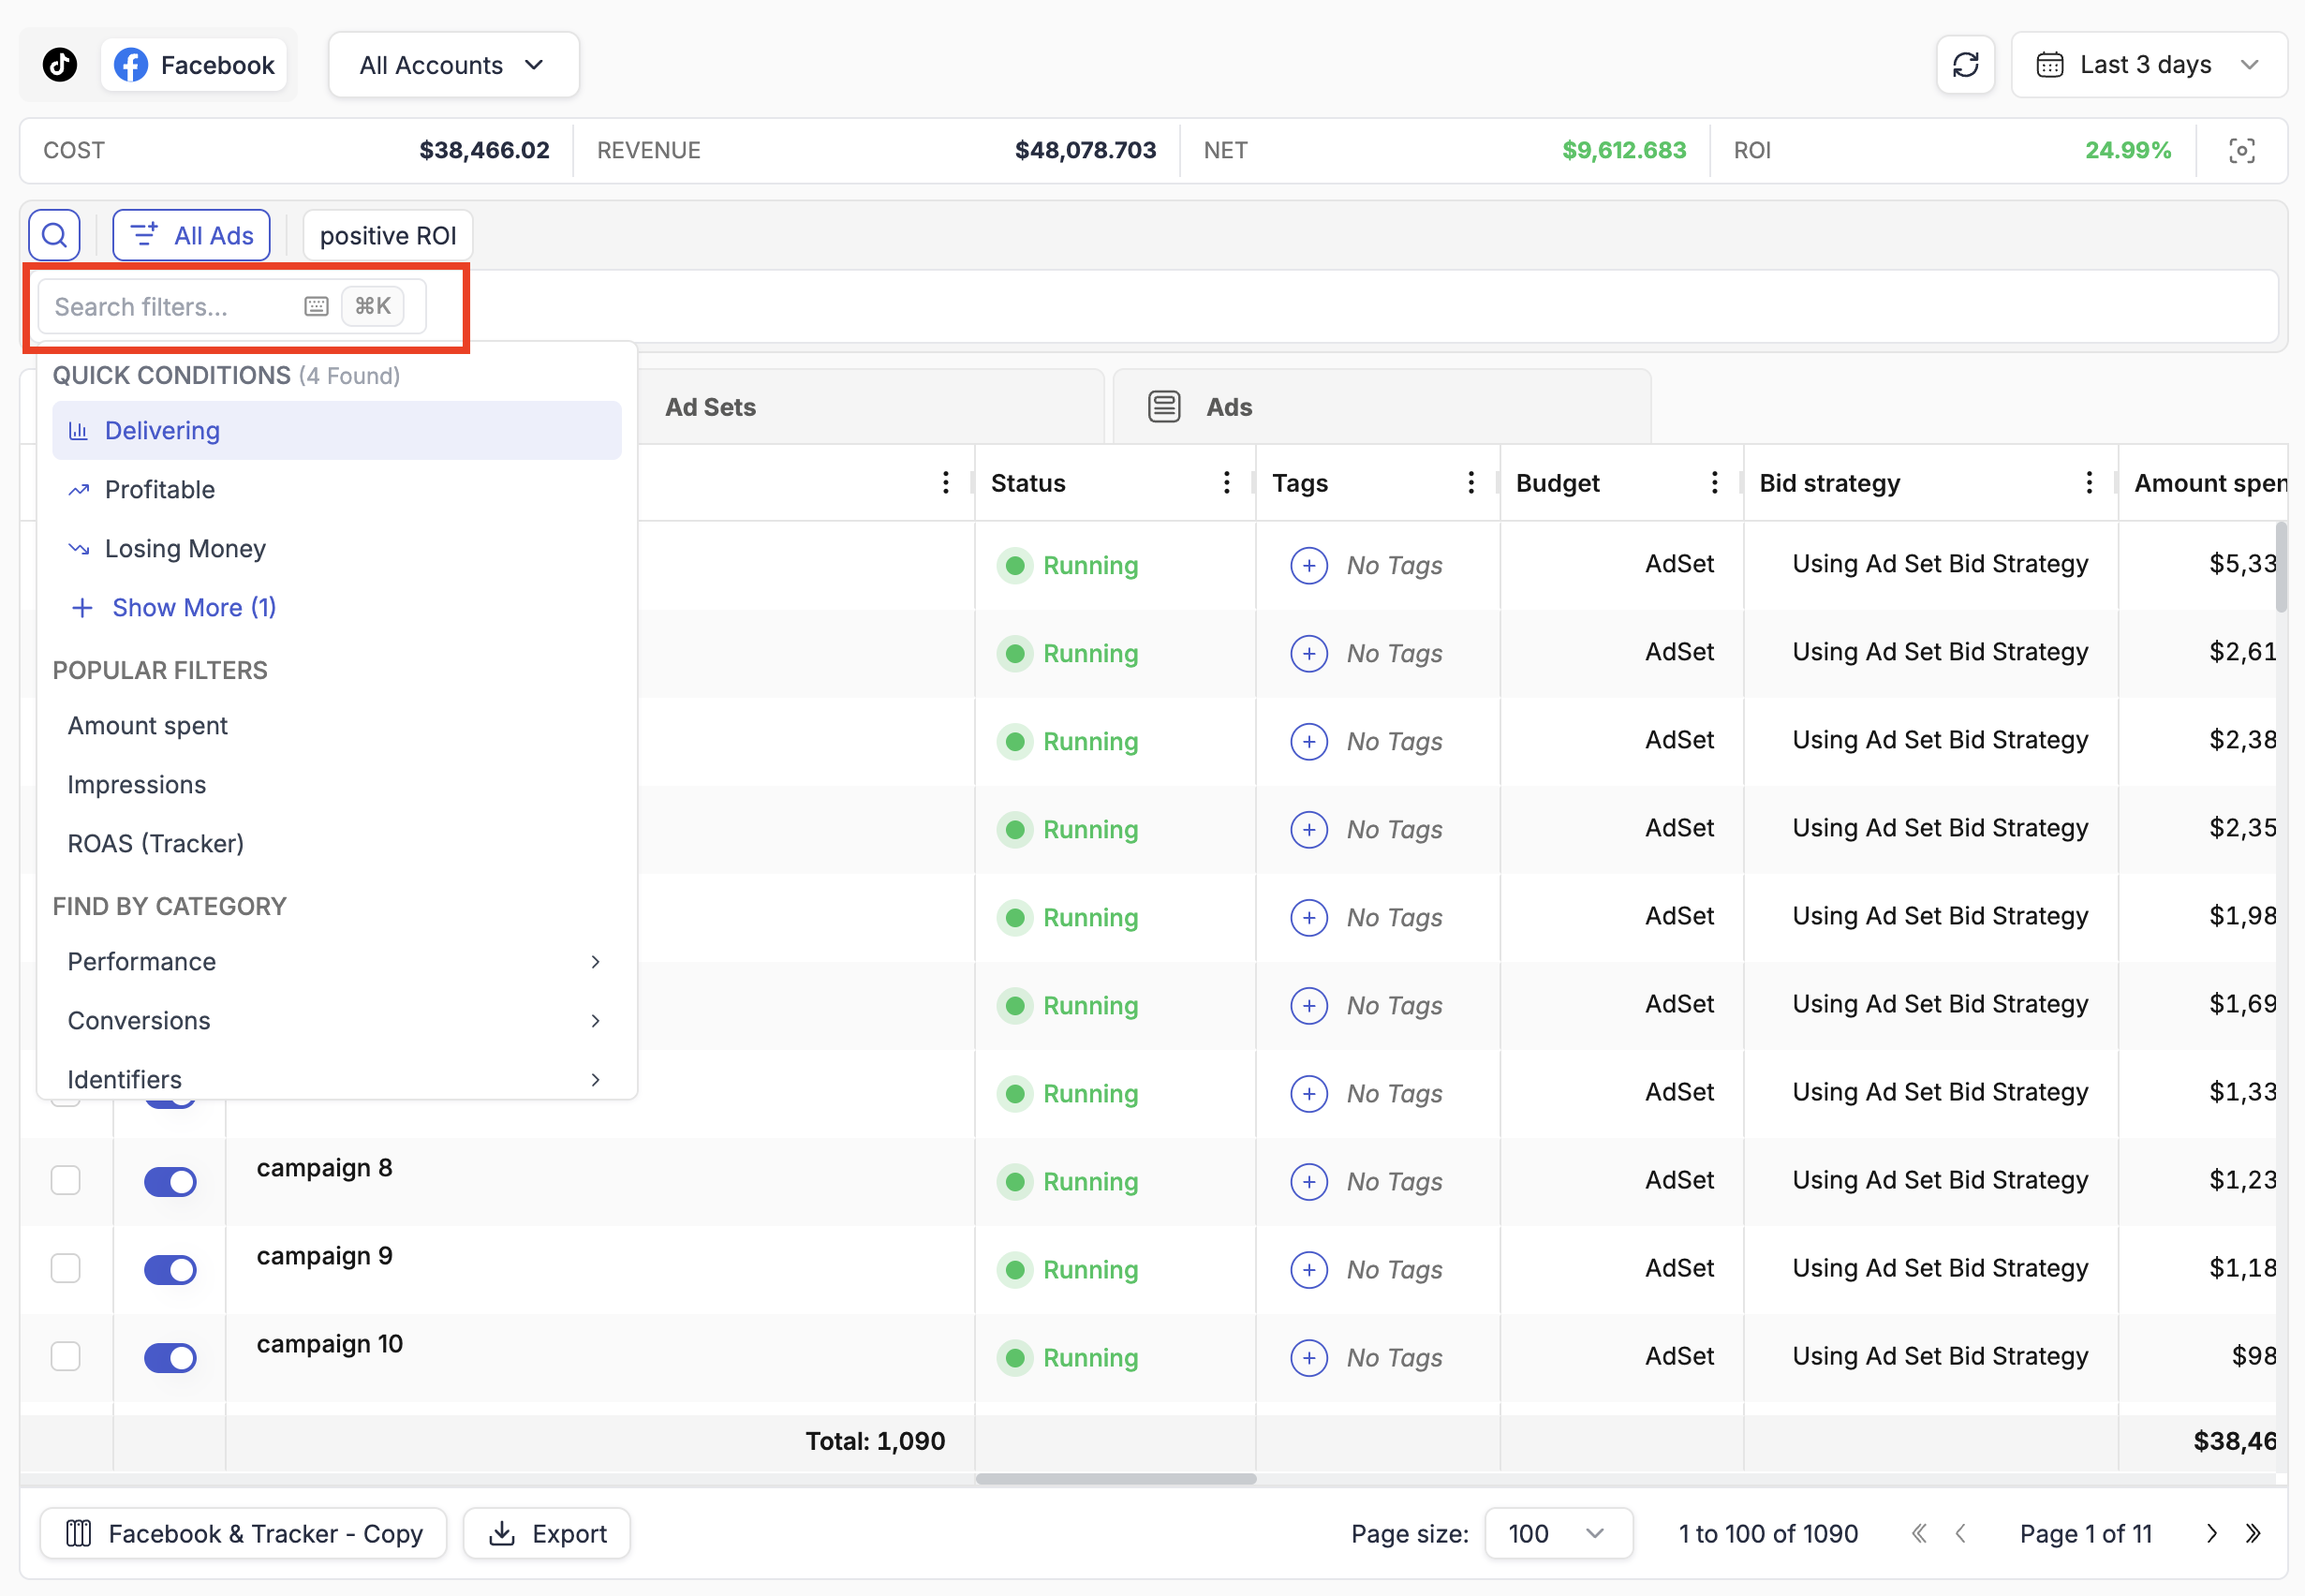
Quick Conditions
At the top of the filter panel you will find Quick Conditions — pre-built filter presets that cover the most common needs:
- Delivering — items with Impressions > 0 (receiving active traffic)
- Profitable — items with NET Profit > 0
- Losing Money — items with NET Profit < 0
These are single-click filters ideal for quickly surfacing what is working and what needs attention.
Popular Filters & Categories
Below Quick Conditions are two more sections:
Popular Filters — a dynamically generated list of the filters you use most frequently. These update as you work, surfacing the metrics you reach for regularly.
Find by Category — a structured directory of all available filter metrics, organised into groups:
| Category | What it contains |
|---|---|
| Performance | Spend, impressions, clicks, CTR, CPC, CPA, ROI, revenue, NET, and other core performance metrics |
| Conversions | Traffic source conversions, tracker conversions, and any custom conversion events you have set up |
| Identifiers | Campaign / ad set / ad names and IDs — useful for filtering to a specific item by name |
| Other | Tags, budgets, start dates, statuses, and other non-metric attributes |
To search for a specific metric, simply start typing in the filter search box — you do not need to browse through the categories.
Keyboard Shortcuts
TheOptimizer's filtering is built for power users who prefer to keep their hands on the keyboard:
- ⌘K / Ctrl+K — opens the filter panel from anywhere in the campaigns view without clicking
- ↑ ↓ — navigate through filter options
- ← → — navigate between filter sub-options (e.g., selecting a condition type or entering a value)
- Enter — confirm a selection or apply a filter value
- Escape — cancel and close the panel
You can build a complete filter — metric, condition, value — entirely from the keyboard without touching your mouse.
Saving Custom Views
Once you have built a filter combination you want to reuse, you can save it as a View. When at least one filter is active, a Create View button appears in the right corner of the filtering bar.
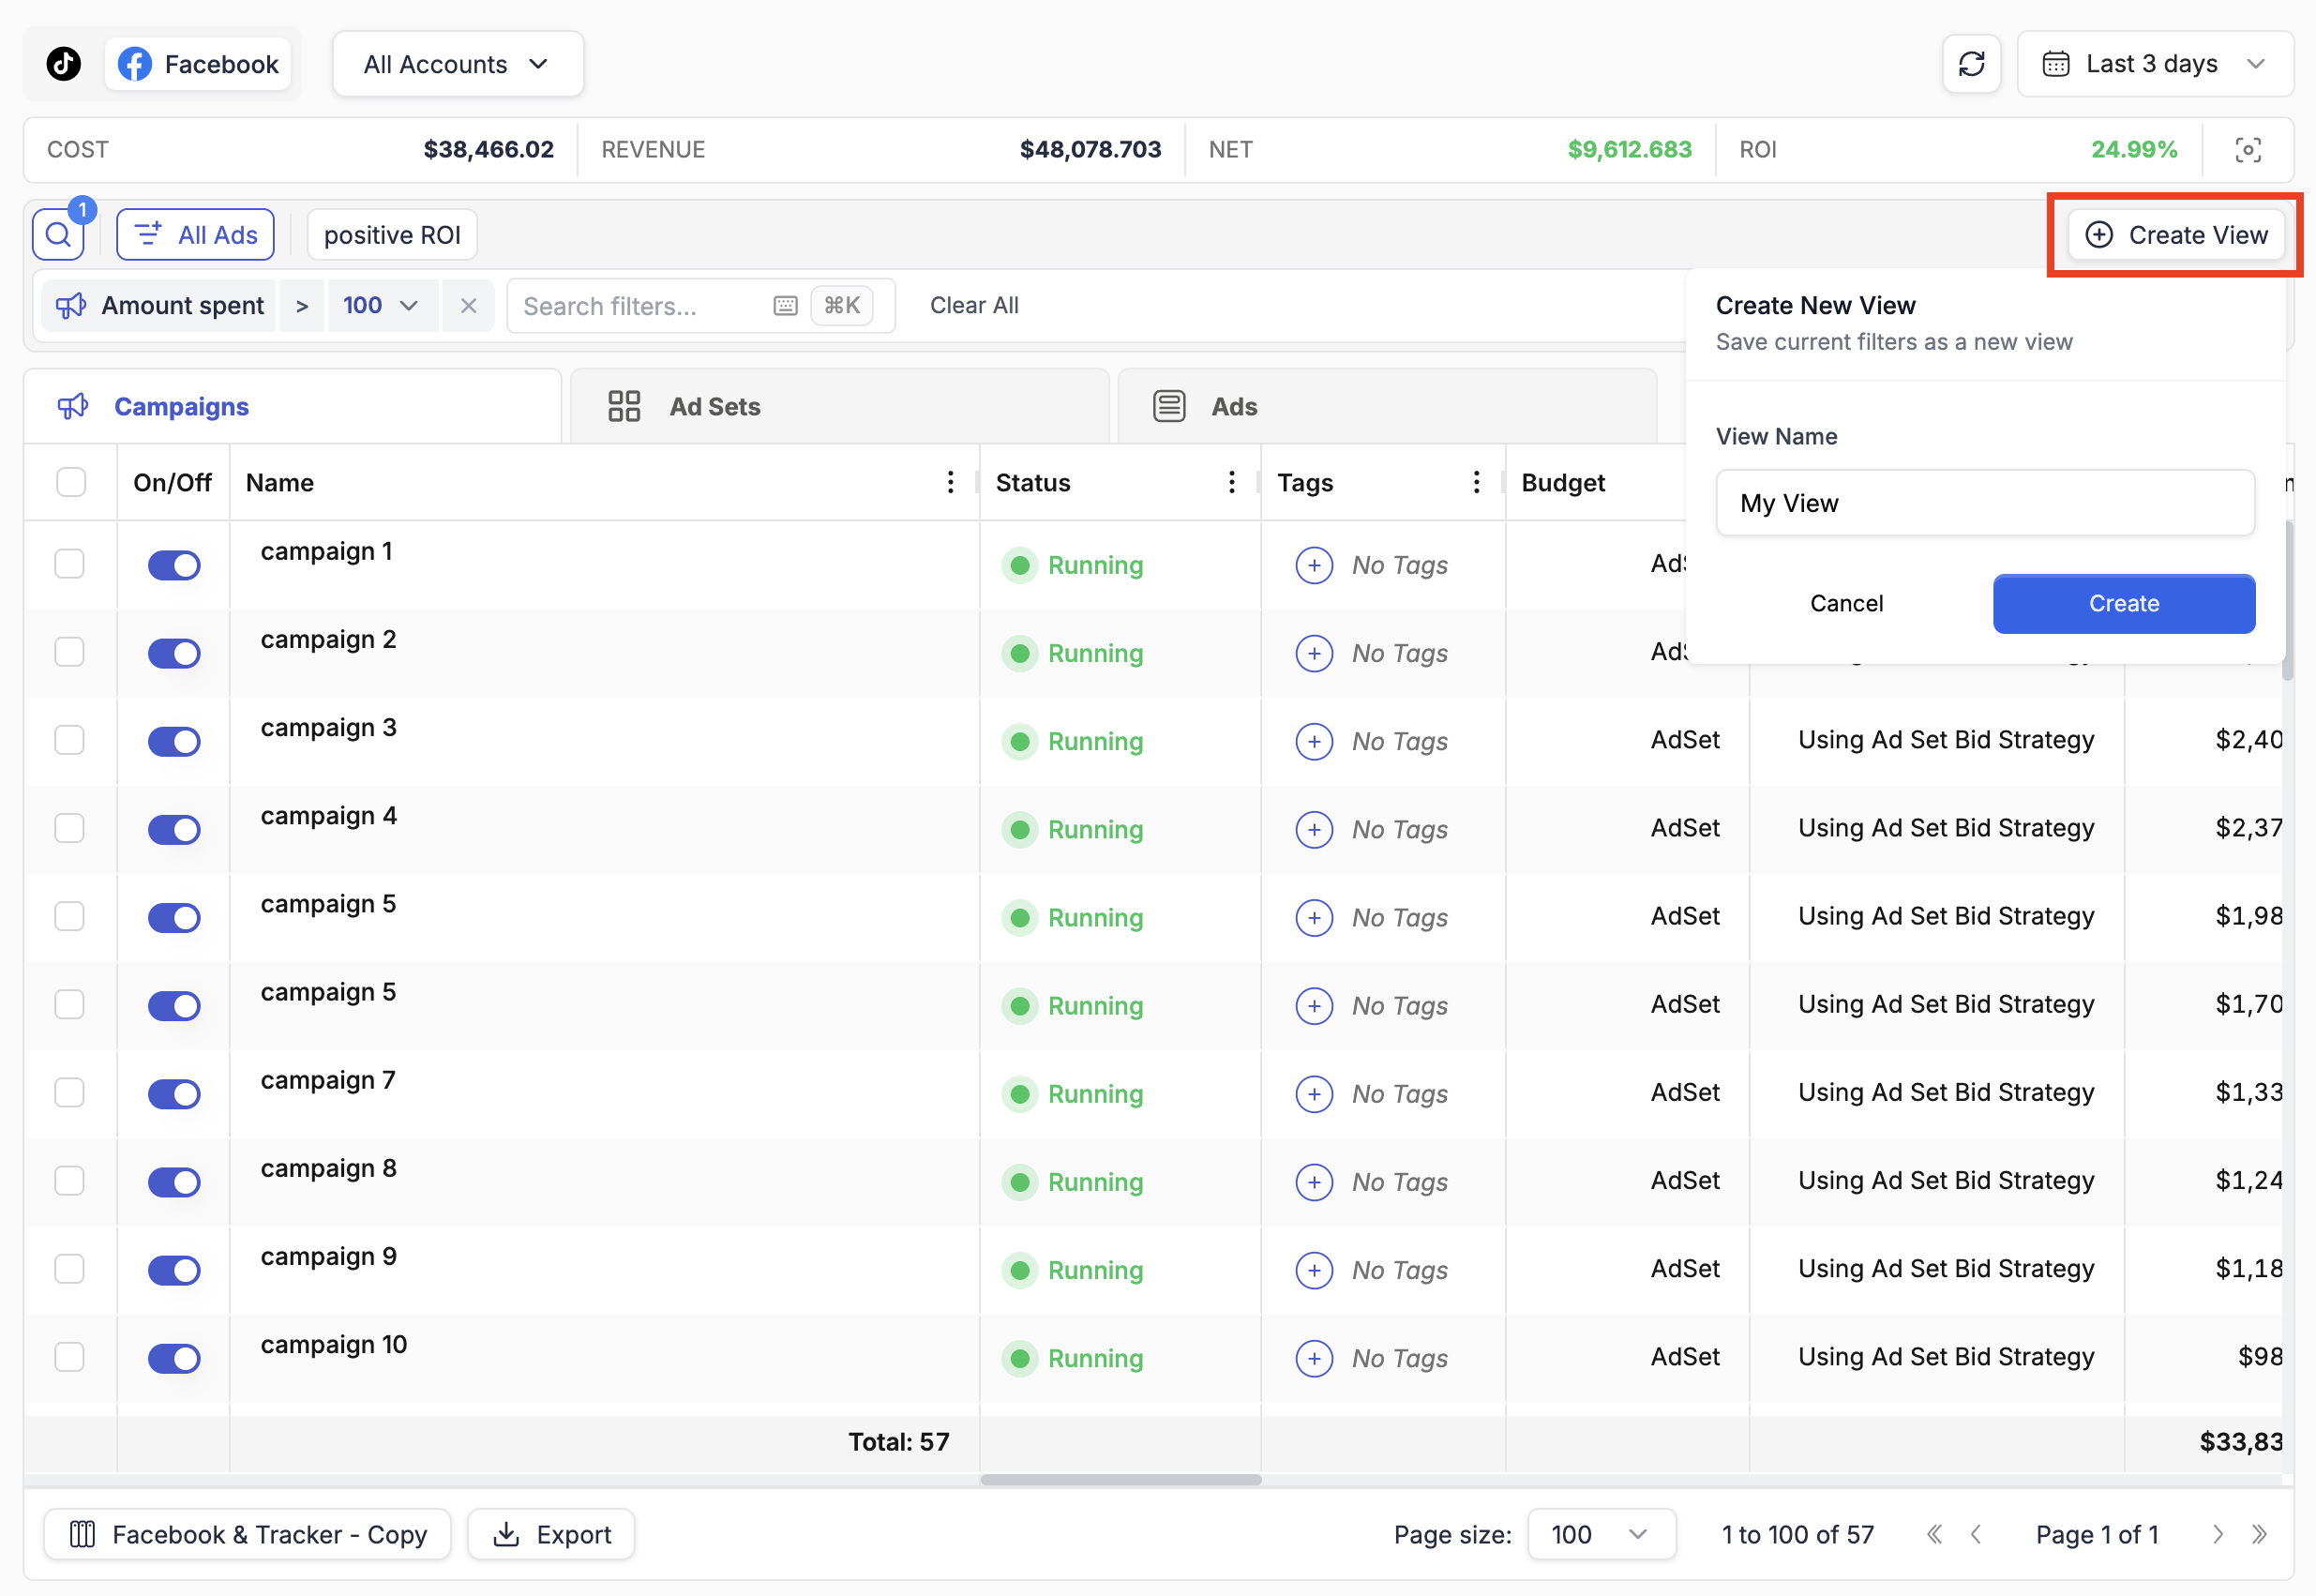
To save a view:
- Apply one or more filters to the filtering bar.
- Click Create View (appears at the right of the filtering bar).
- Enter a name for the view.
- Click Create.
The saved view appears as a clickable tag above the filtering bar. A single click applies the entire filter combination instantly. This is particularly useful for recurring workflows like "Check all Facebook campaigns with negative ROI" or "Show only delivering TikTok ad sets."
💡 Tip: Create views for your most common morning review filters — for example, a "Profitable" view per network, or a "High Spend / No Conversions" view for catching wasted budget fast.
3. Manage Campaigns
The main table is the workspace for day-to-day campaign management. It is designed to feel familiar: the structure deliberately mirrors what you already know from Facebook Ads Manager, TikTok Ads, and similar platforms — with the added dimension of working across all your accounts in one place.
Campaigns, Ad Sets & Ads Tabs
Three tabs sit above the table: Campaigns, Ad Sets, and Ads (some networks use "Ad Groups" instead of Ad Sets). Each tab shows all items of that type across every selected ad account.
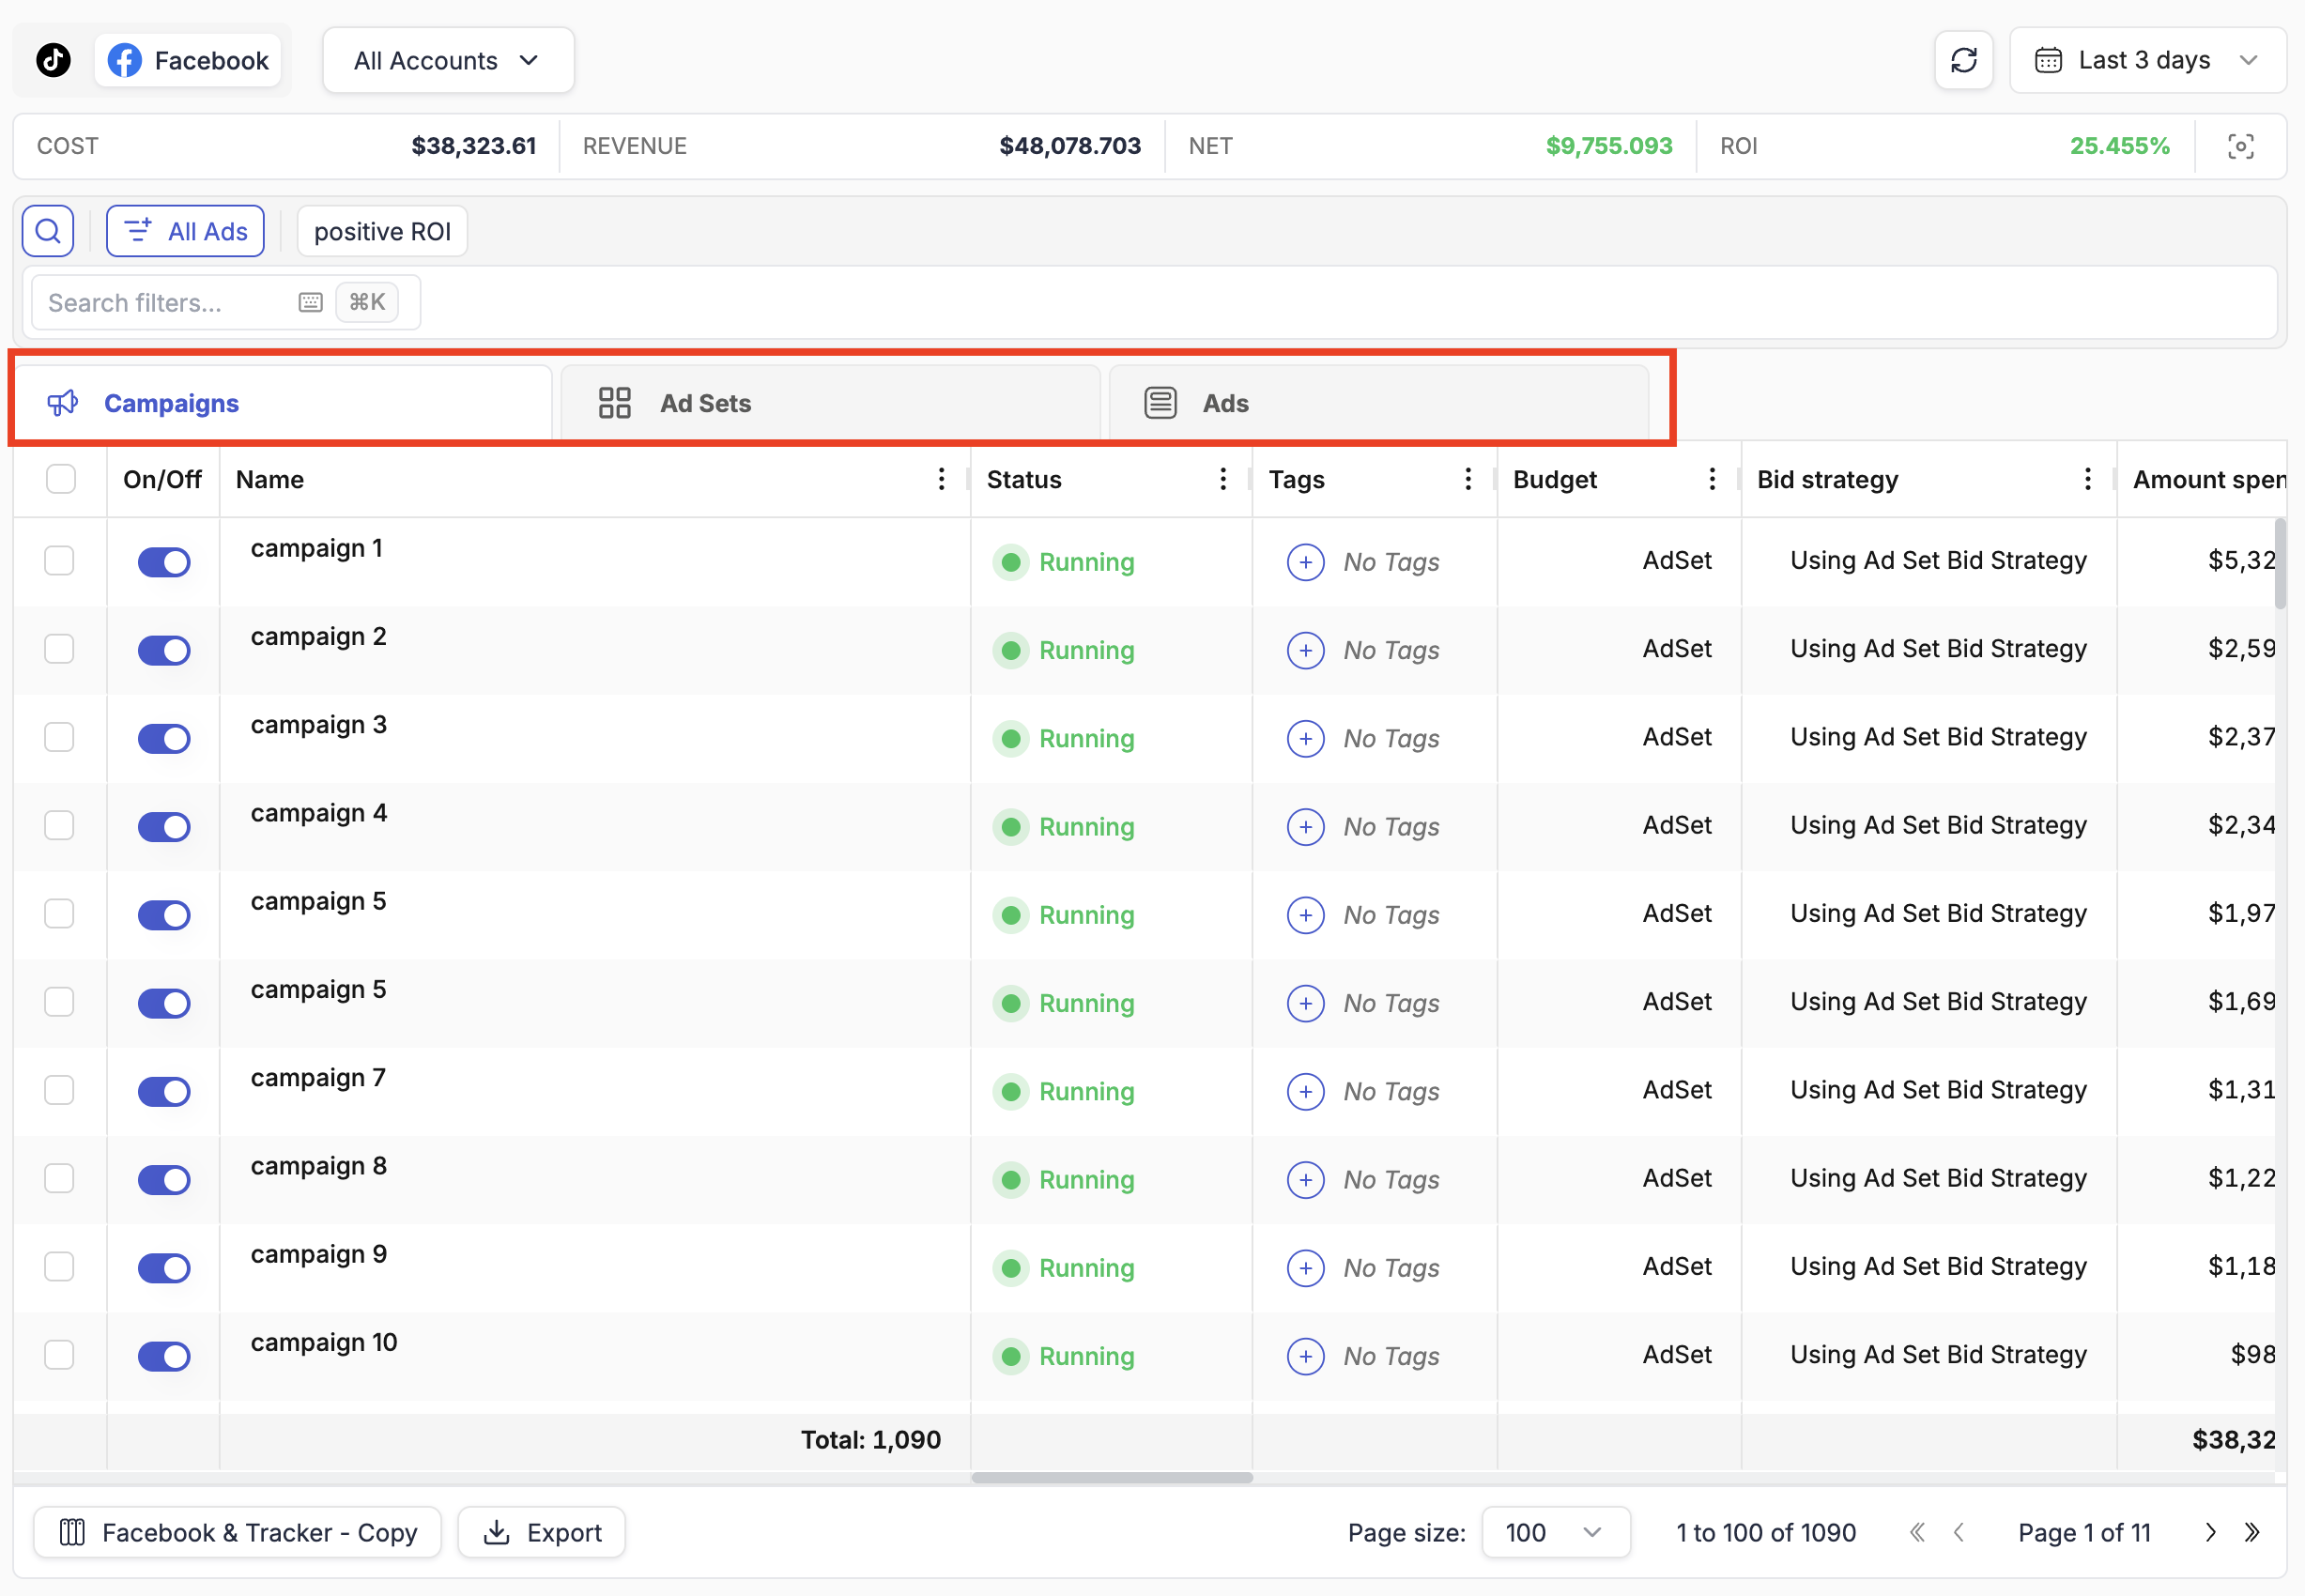
Navigation behaviour:
- Clicking a tab with no items selected shows all items of that type across your accounts — a powerful cross-account view you cannot get in native ad managers.
- Selecting one or more campaigns on the Campaigns tab and then switching to Ad Sets filters the list to show only ad sets belonging to the selected campaigns.
- Selecting ad sets and switching to Ads filters to show only ads within those ad sets.
This mirrors the drill-down navigation of native ad managers, but with the cross-account breadth of a unified platform.
Inline Actions
For individual items, several actions are available directly within the table row without opening any dialog:
- On/Off toggle — the blue toggle at the left of each row pauses or activates the item immediately.
- Budget — if the budget cell is editable (indicated by a pencil icon on hover), click to modify the daily or lifetime budget inline.
- Bid — similarly, bid values can be edited inline where supported by the ad network.
Click the value, make your change, and press Enter to confirm or Escape to cancel.
Bulk Actions
To act on multiple items at once, check the boxes at the left of each row. Once one or more items are selected, a floating action bar appears at the bottom of the page.
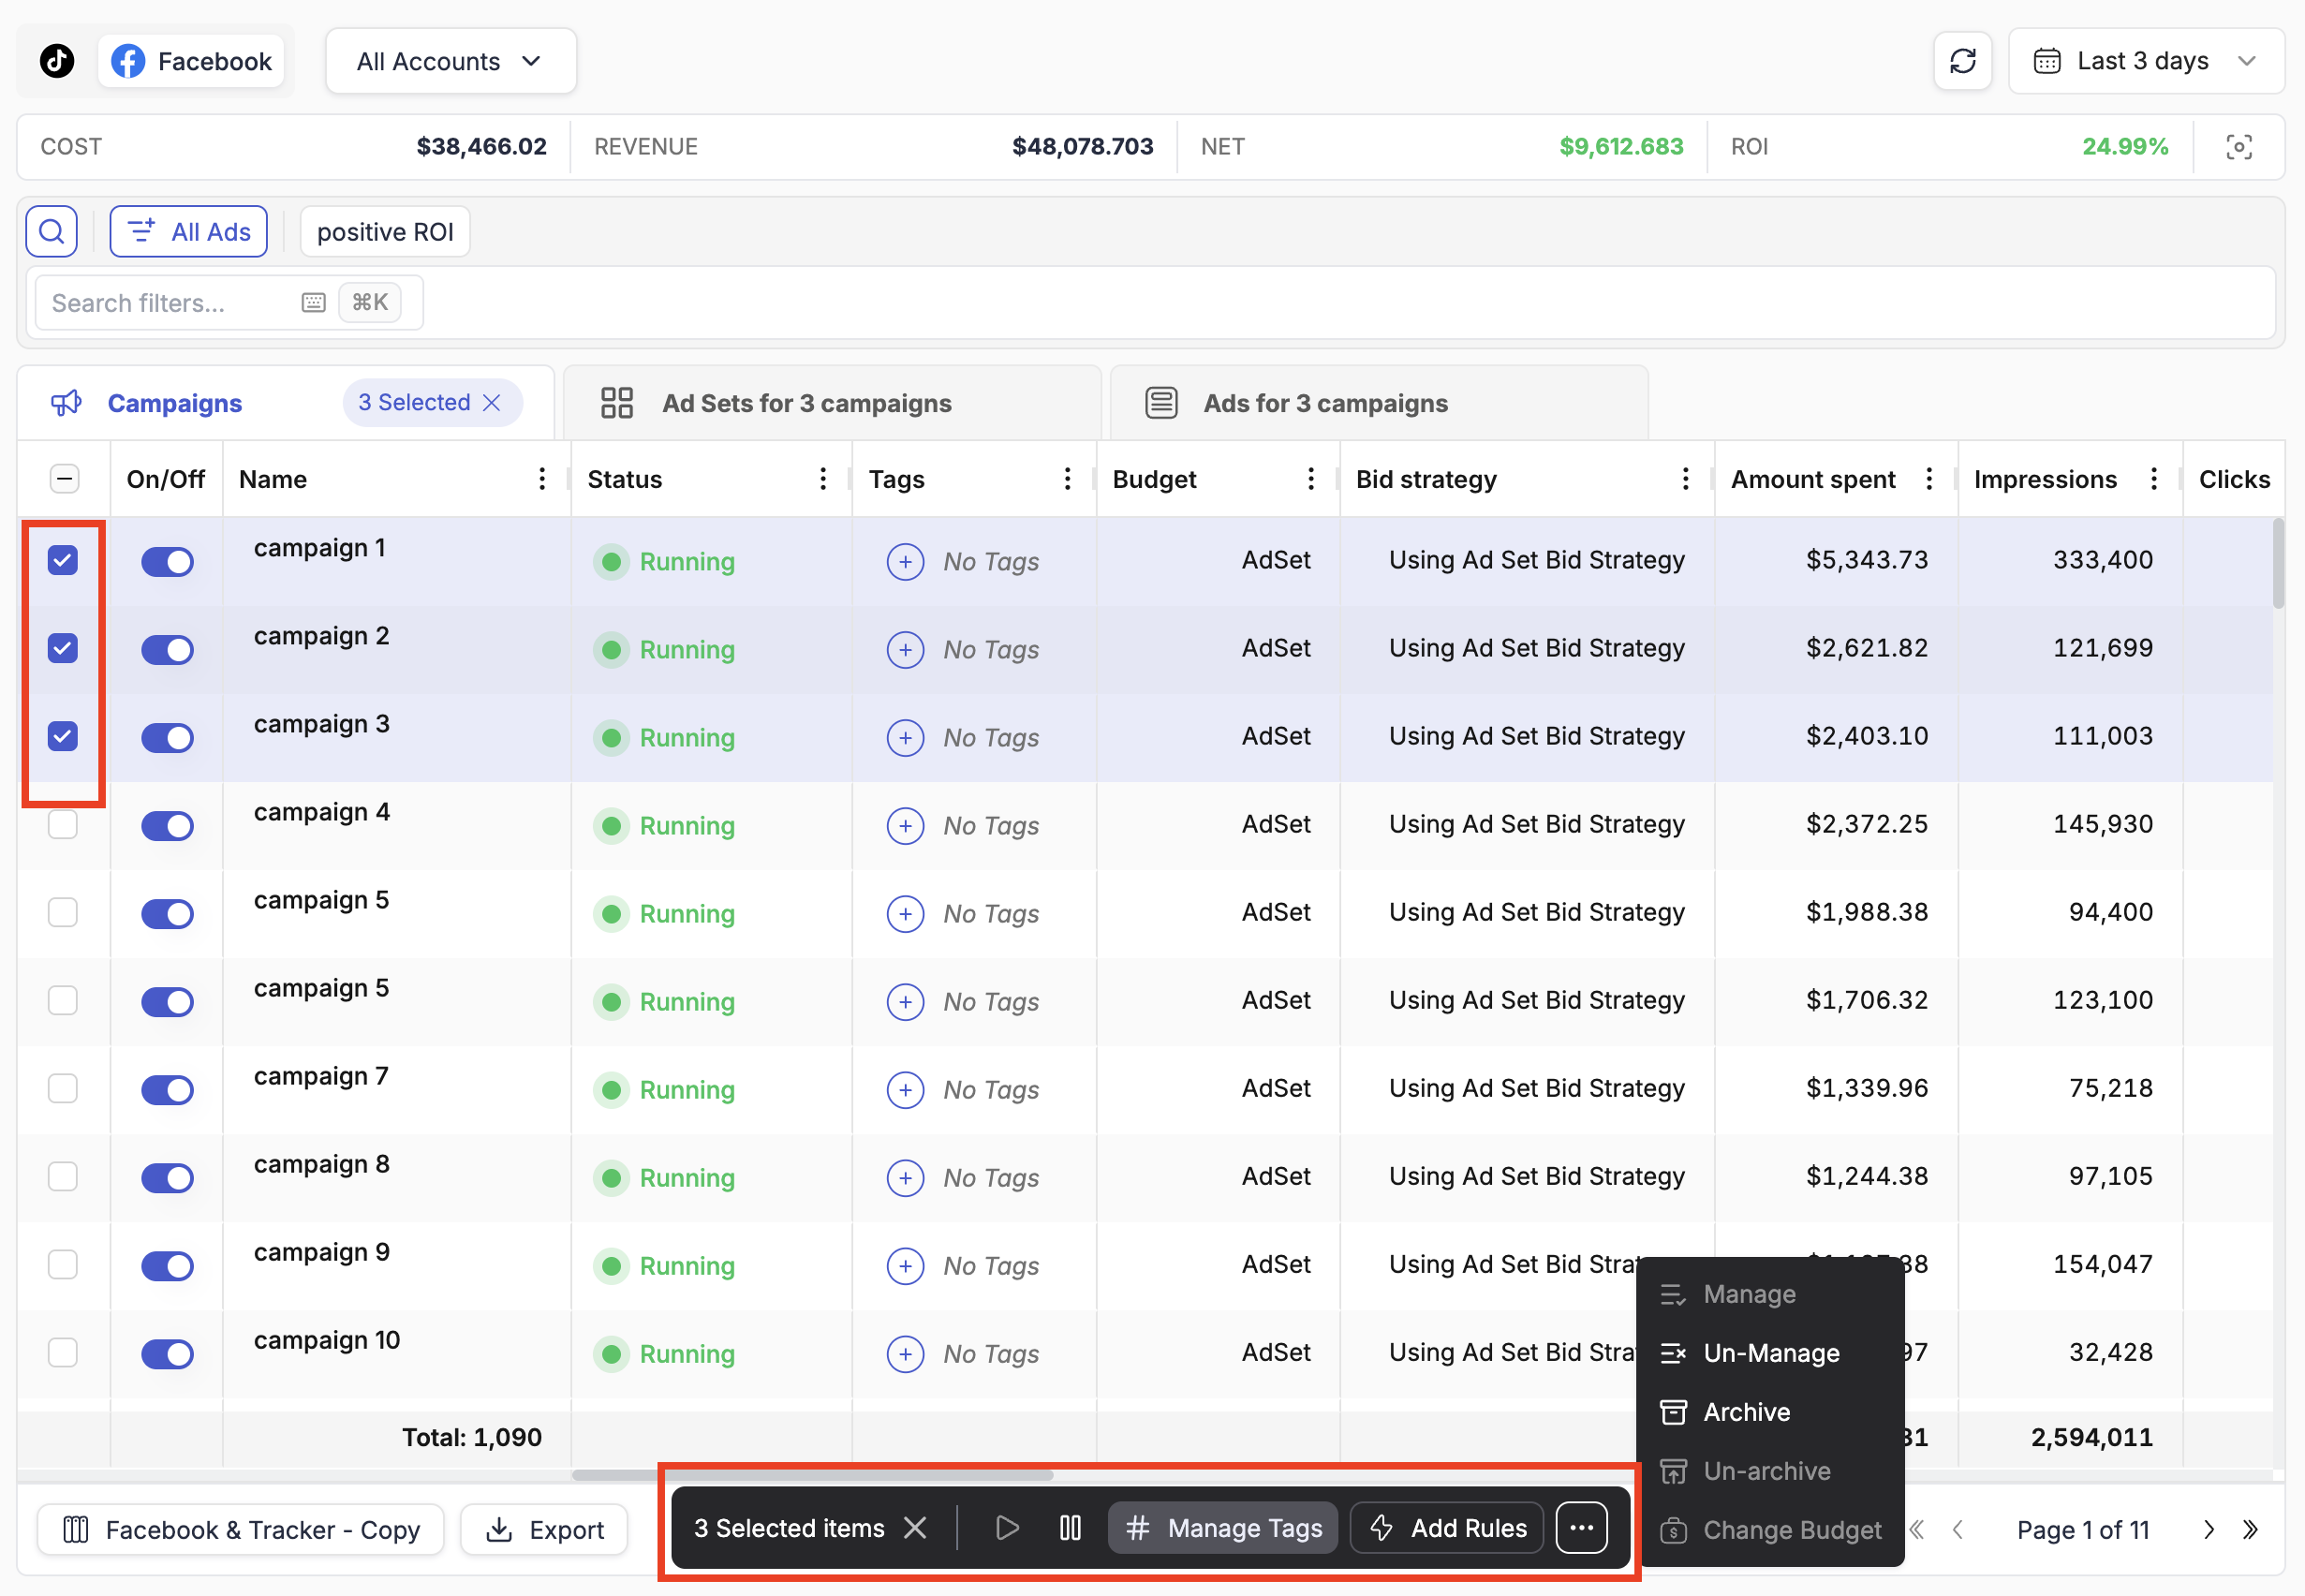
Available bulk actions include:
- Play / Pause — activate or pause all selected items
- Change Budget — apply a budget change to all selected items at once
- Manage Tags — add or remove tags on selected items
- Add Rules — attach an automation rule to all selected items simultaneously
- Manage / Un-Manage — include or exclude items from TheOptimizer's automation scope
- Archive / Un-archive — archive campaigns you no longer want displayed
ℹ️ Note: Archive and Manage / Un-Manage are only available through the bulk action bar, not as inline actions. This is intentional — these are higher-impact operations most commonly applied to multiple items at once, so they are kept out of the inline row to avoid accidental single-item changes.
Keyboard Navigation
The main table can be navigated entirely from the keyboard:
- ↑ ↓ ← → — move between cells in the table
- Enter — if the focused cell is editable, press Enter to start editing; press Enter again to confirm the change
- Escape — abort an edit without saving
Combined with the keyboard-first filtering (Section 5), it is possible to run a full campaign review session — filter, browse, edit budgets and bids — without ever reaching for the mouse.
Campaign Name Hover Options
When you hover your cursor over a campaign name (or ad set or ad name) in the table, three options appear to the right of the name:
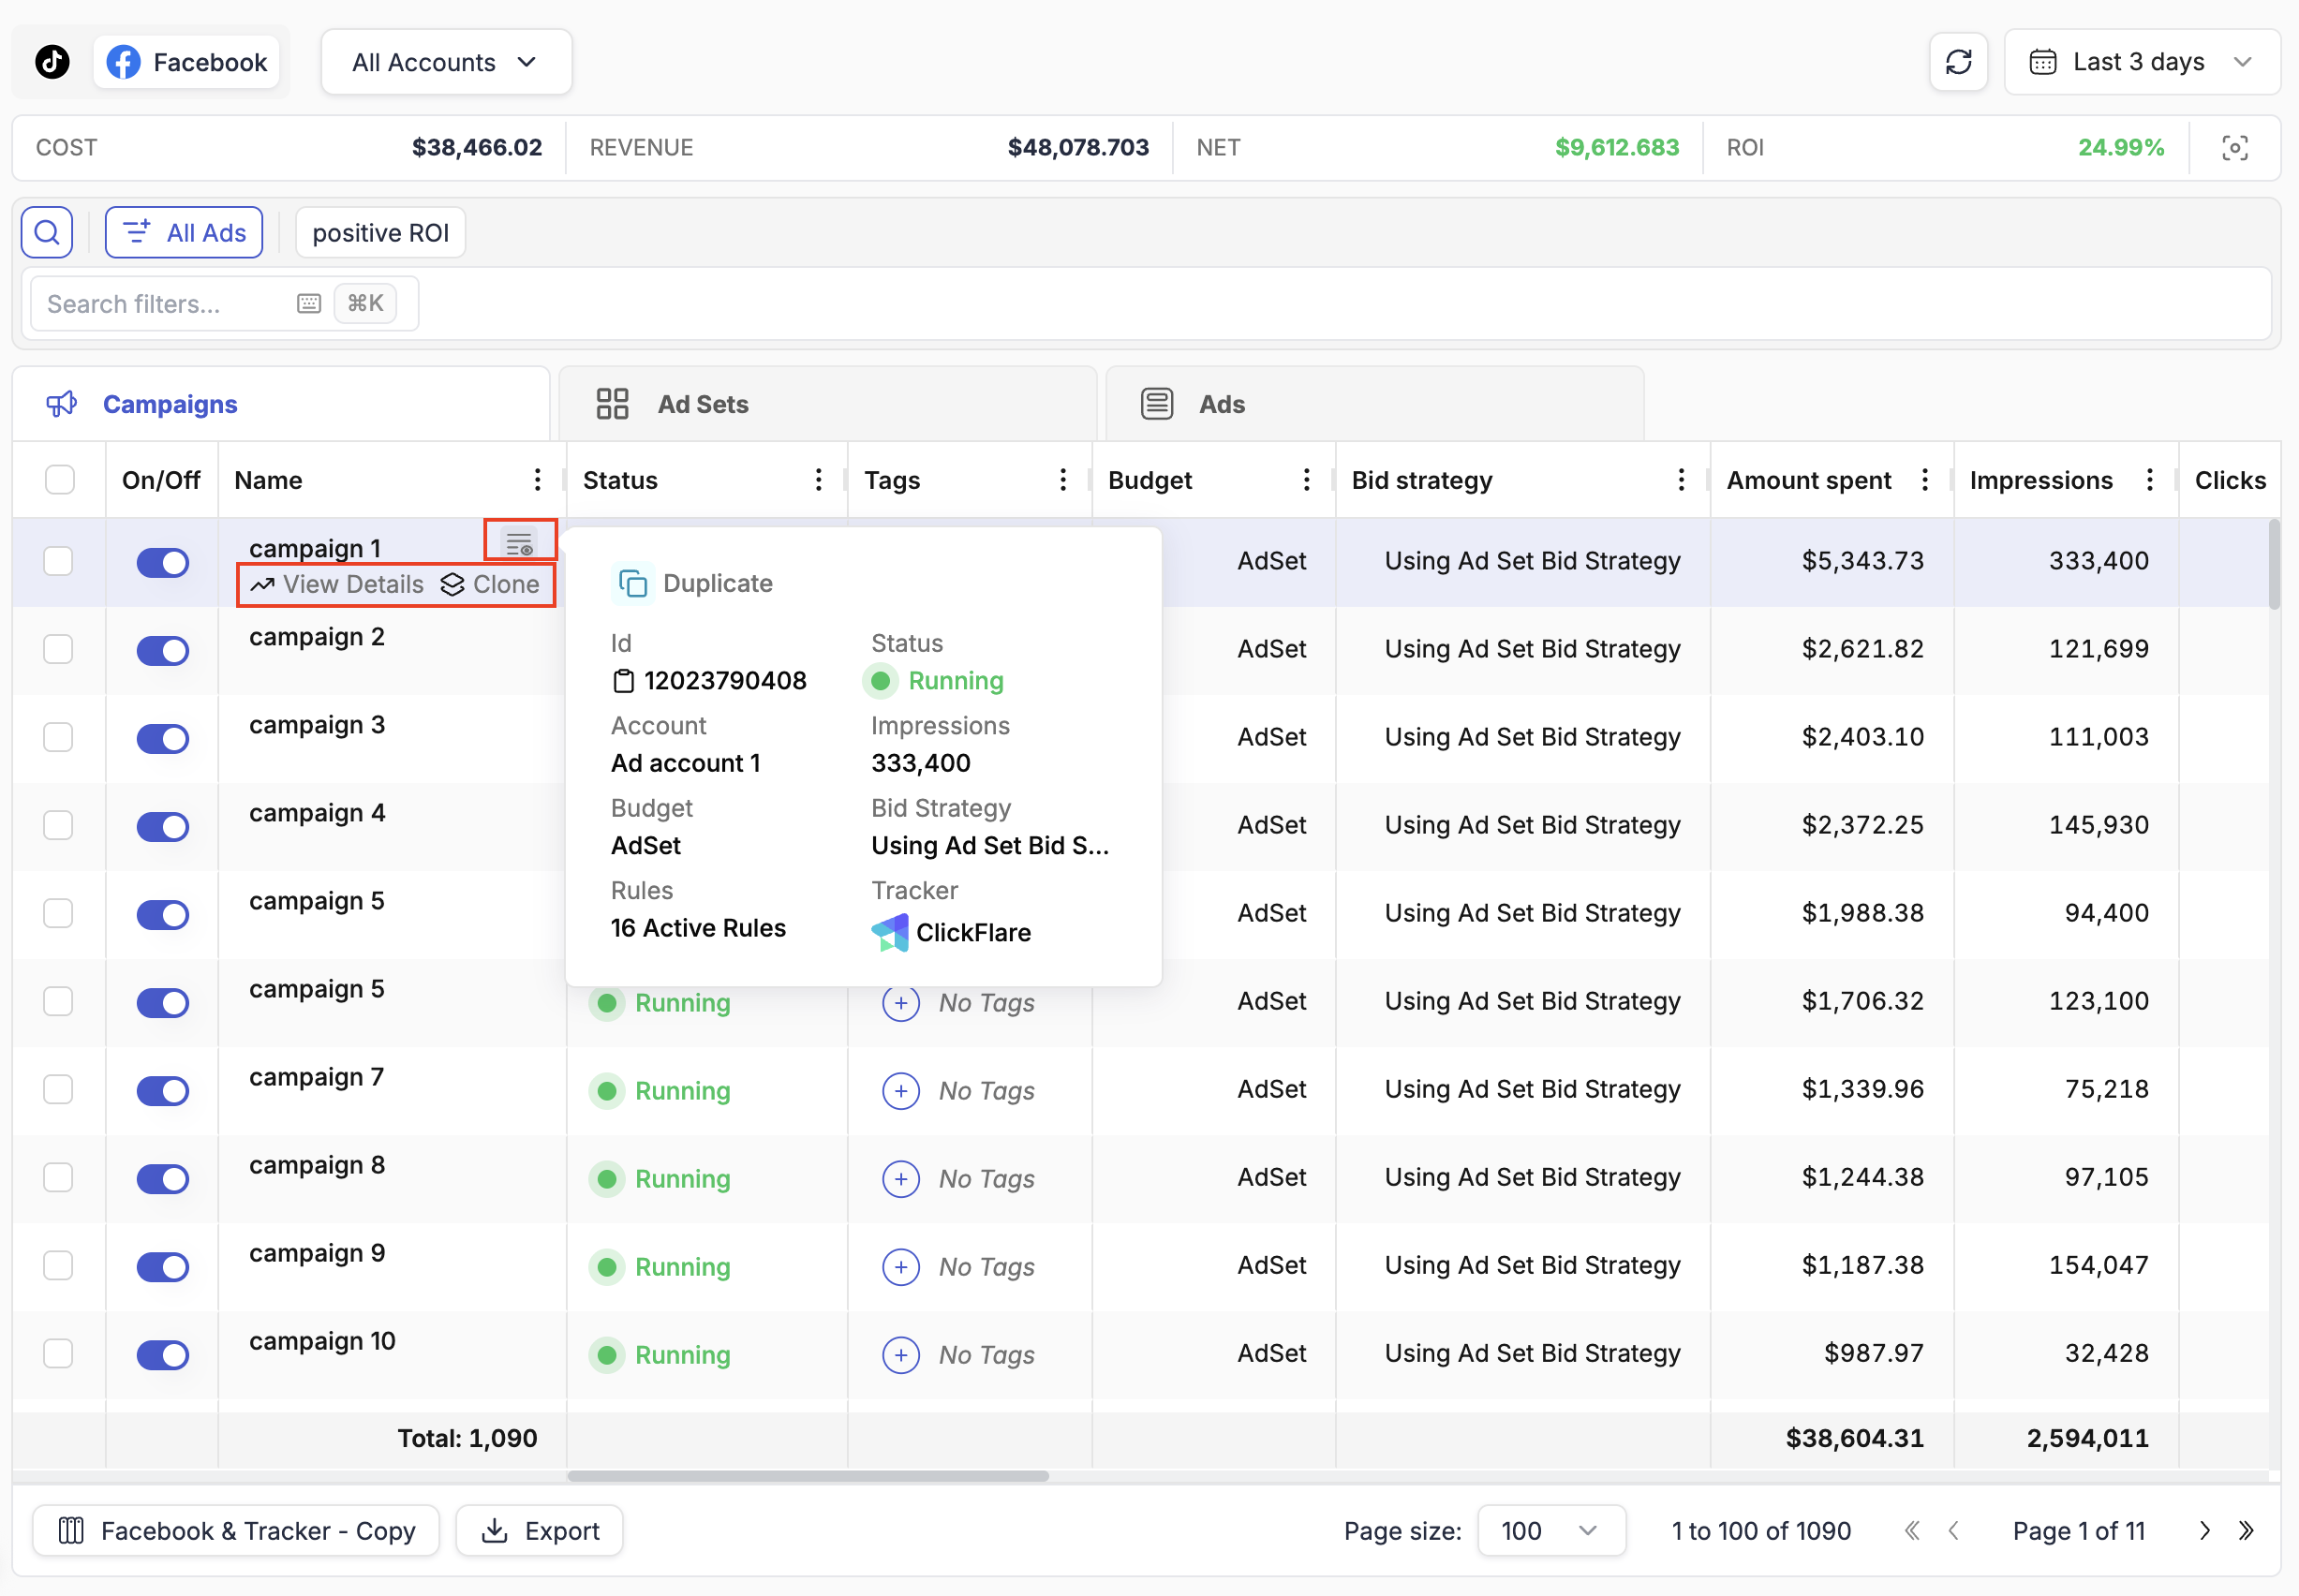
| Option | What it does |
|---|---|
| View Details | Opens the full Details View panel for that item (see Section 9) |
| Clone | Starts the cloning workflow for the campaign, ad set, or ad |
| Quick Details (info icon) | Shows a compact popup with key campaign metadata without opening the full Details View |
The Quick Details popup is particularly useful during a fast review pass. It surfaces the campaign ID, ad account, advertising objective, budget, and bid strategy at a glance — enough to answer most quick questions without navigating away from the table.
💡 Tip: Use the Quick Details popup to copy a campaign ID instantly. Hover over the campaign name, click the info icon, and the ID is right there ready to copy — no need to open the campaign settings.
4. Campaign Details View
The Details View is a side panel that slides in from the right when you click View Details on any campaign, ad set, or ad. It provides a deeper look at a single item without leaving the main table — and supports continuous navigation between items so you can review multiple campaigns without repeatedly opening and closing the panel.
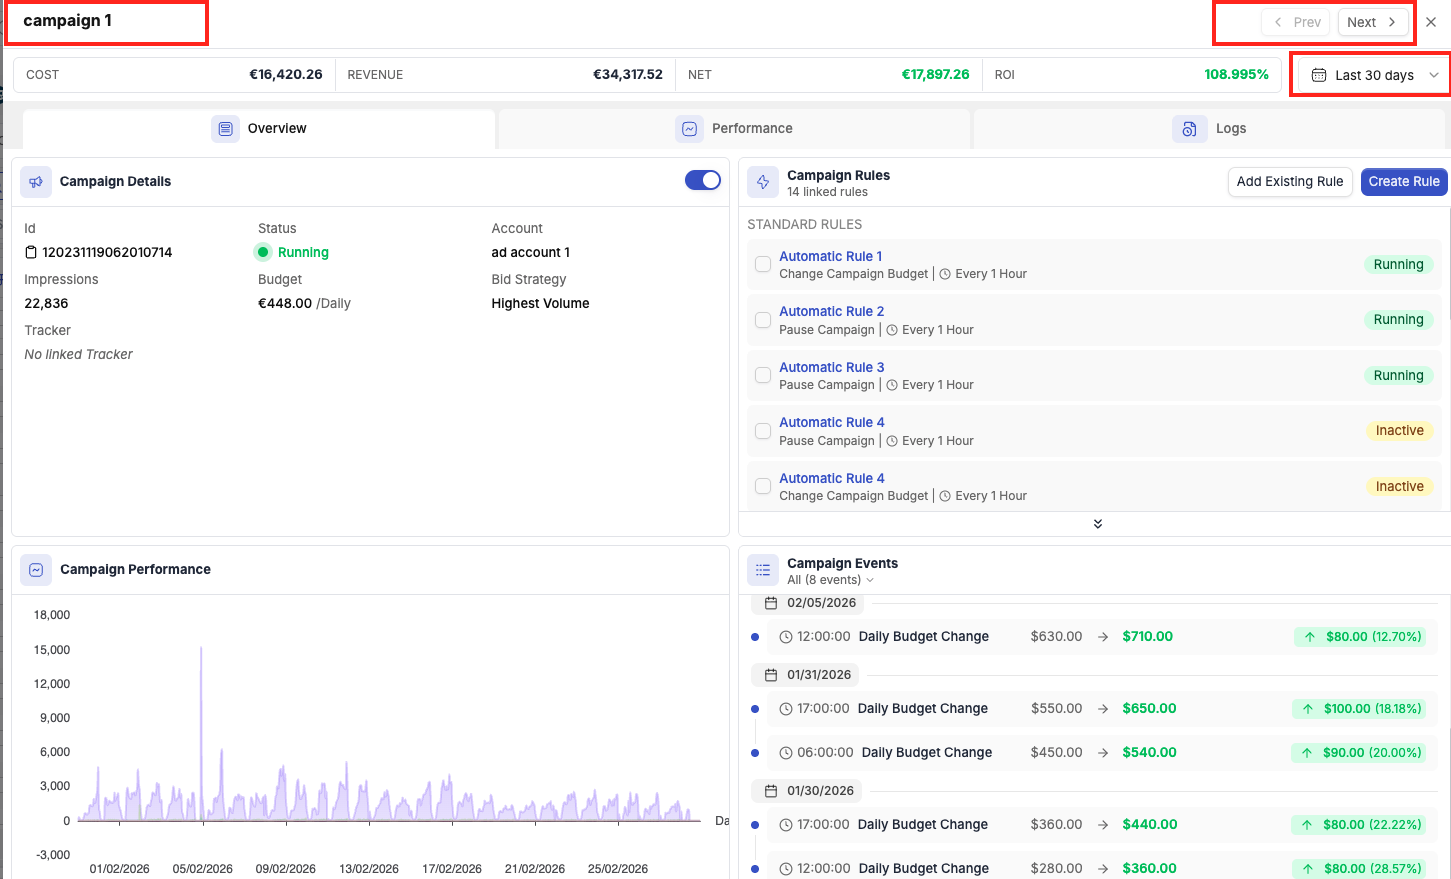
At the top of the Details View panel:
- Item name — the name of the campaign, ad set, or ad you are viewing
- ← Prev / Next → navigation — move to the previous or next item in the table without closing the panel
- Totals — a summary bar showing Cost, Revenue, NET, and ROI for this specific item
- Date picker — adjusts the data shown in the Details View independently from the main table date picker
Overview Tab
The Overview tab is the first tab in the Details View and provides a snapshot of the item's status, configuration, and recent activity. It contains four widgets:
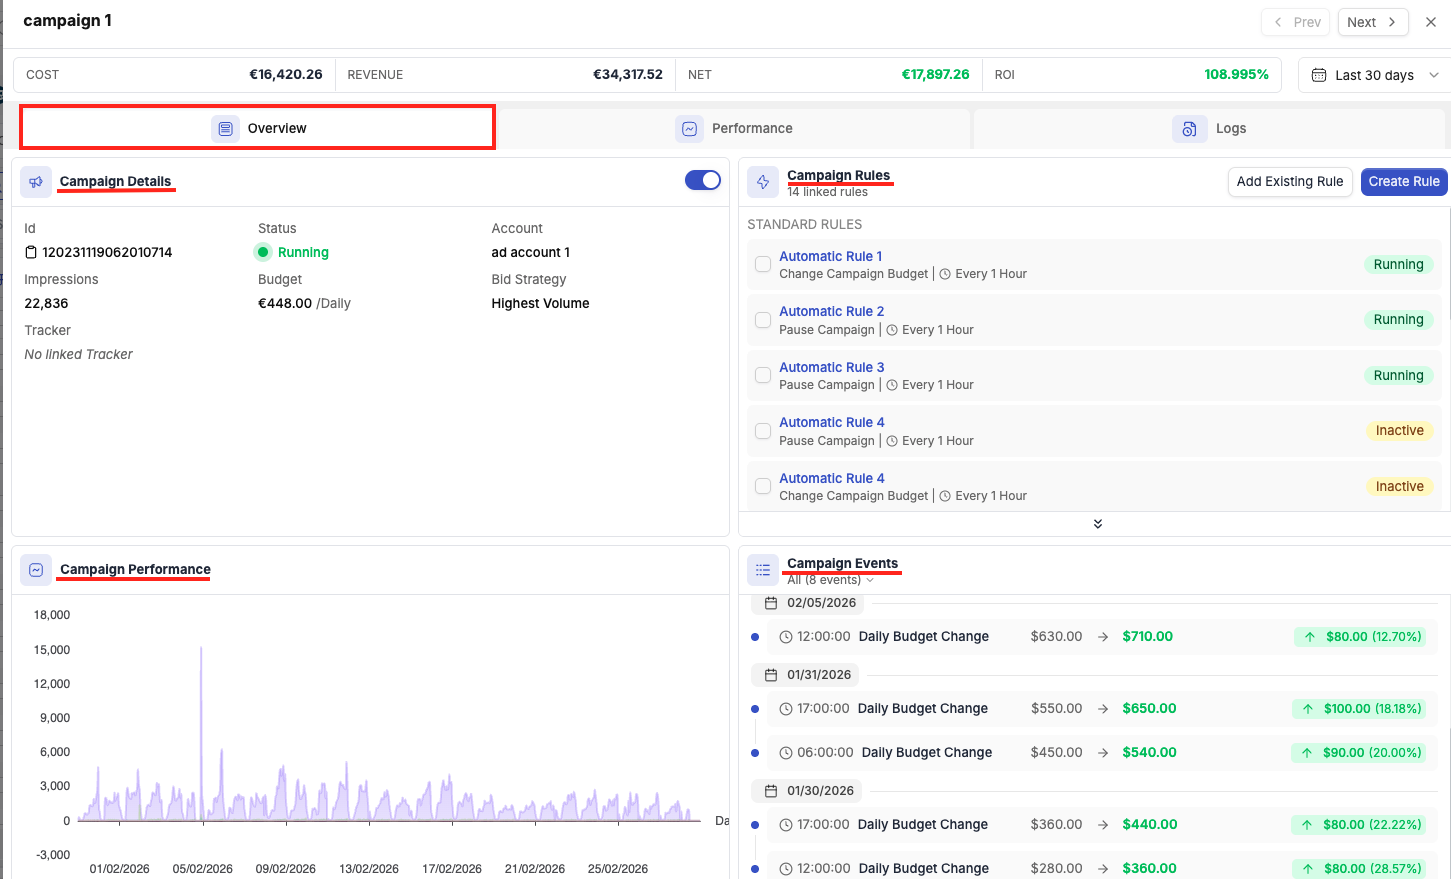
Campaign Details
A card showing the item's key configuration data:
- ID — the campaign/ad set/ad ID on the ad network
- Status — current status (Running, Paused, etc.)
- Account — which ad account it belongs to
- Budget — daily or lifetime budget and type
- Bid Strategy — the bidding approach (e.g., Highest Volume, Cost Cap, Target CPA)
- Tracker — which tracking platform is linked, if any
Quick action controls are also present here — you can turn the item on or off directly from the Details View without going back to the main table. This makes it practical to use the Details View as a decision-making panel: check the details, decide to pause or activate, do it immediately, then navigate to the next item.
Campaign Rules
A list of all automation rules currently attached to this campaign. From here you can:
- Add Existing Rule — link a rule you have already created to this campaign
- Create Rule — build a new rule and attach it in one step
💡 Tip: Reviewing attached rules in the Details View is a fast way to audit what automation is in place for a specific campaign without navigating to the Rules section.
Campaign Performance
A line chart showing the trend of key metrics — Amount Spent, Revenue, Conversions, and Clicks — over the selected date range. Use this to get an at-a-glance sense of whether the campaign is trending up, down, or flat.
Campaign Events
A timeline of all significant changes the campaign has undergone during the selected period — budget changes, bid changes, status changes, and similar events. This is your audit trail for understanding when something changed and correlating it with performance shifts visible in the Performance chart above.
💡 Tip: Use Campaign Events alongside the Performance chart together. If you see a dip in conversions, scroll the Events timeline to see whether a budget cut, bid change, or rule action happened around the same time.
Performance Tab
The Performance tab provides breakdown reporting for the specific item you are viewing. Unlike the main table (which shows aggregate data per campaign), the Performance tab lets you break a single campaign's data down by time dimension.
The key breakdown available are By Hour, By Hour of Day and By Day.
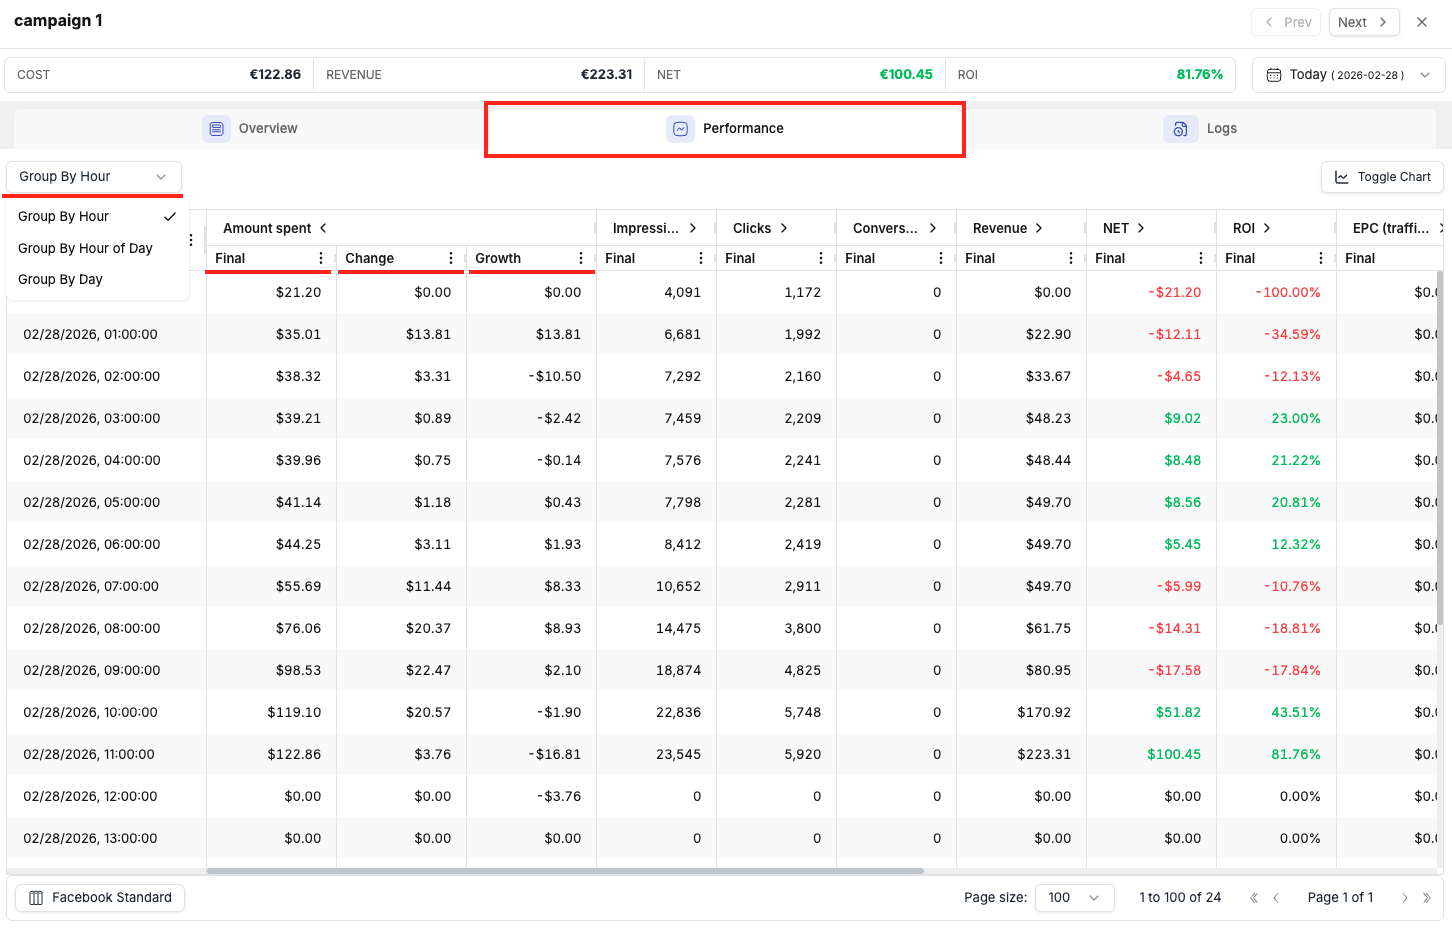
When grouping By Hour of Day is used for example, with a multi-day date range (e.g., Last 7 Days), it aggregates traffic from all days at each hour — so "10 AM" shows the combined performance of every 10 AM to 11 AM slot across the entire selected period.
Practical use case — Day Parting:
- Go to the Details View for a campaign you want to optimise.
- Set the date range to Last 7 Days or Last 14 Days.
- Click the Performance tab.
- Set the grouping to Hour of Day.
- Review which hours of the day have strong conversions and ROI, and which are weak.
- Use these findings to configure time-based automation rules that pause the campaign during low-performing hours and resume it during peak hours.
💡 Tip: The Performance tab is available at campaign, ad set, and ad level. Running an hourly breakdown on a specific ad set can help you understand whether poor performance is time-related or structural — giving you a more targeted optimisation path than looking at the campaign aggregate.
Logs Tab
The Logs tab shows a complete history of all actions that have affected the item — whether triggered by automation rules or made manually by a team member.
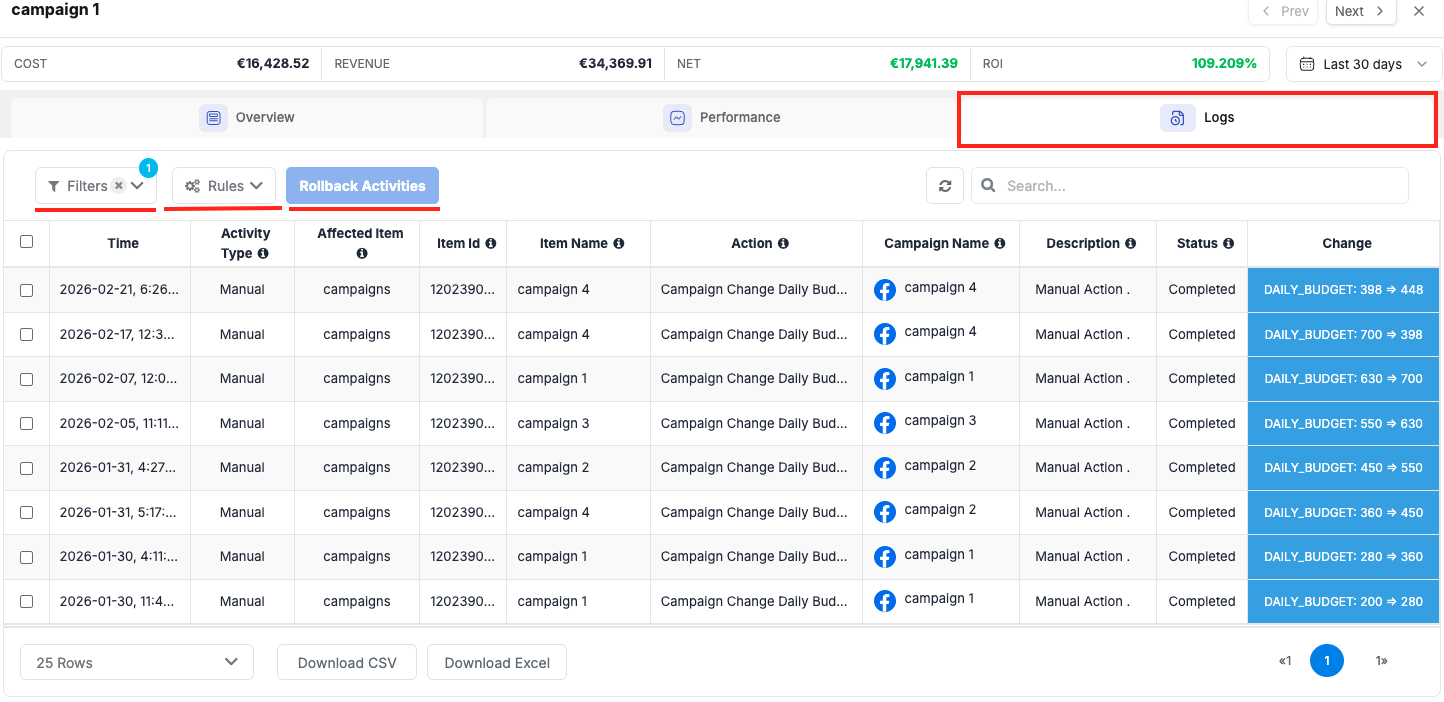
Each log entry shows:
- Time — when the action occurred
- Action — what was done (e.g., budget changed, campaign paused, bid adjusted)
- Activity Type — whether the action came from a rule (and which rule) or from a manual user action
- Change — the specific change made (e.g., budget changed from $50 to $75)
You can filter the logs by:
- Rule — show only actions triggered by a specific rule
- Type — show only manual actions, or only rule-triggered actions
You can rollback changes in bulk by selecting them and then clicking on Rollback Activities.
💡 Tip: The Logs tab is invaluable when you need to investigate why a campaign's performance changed unexpectedly. Cross-reference the log timestamps with the Campaign Performance chart in the Overview tab to understand what action preceded the change.
The "Manage" Tab
Beyond the three universal tabs (Overview, Performance, Logs), some ad networks add extra tabs to the Details View that expose platform-specific optimisation data.
Native Ad Networks (Taboola, Outbrain, and others)
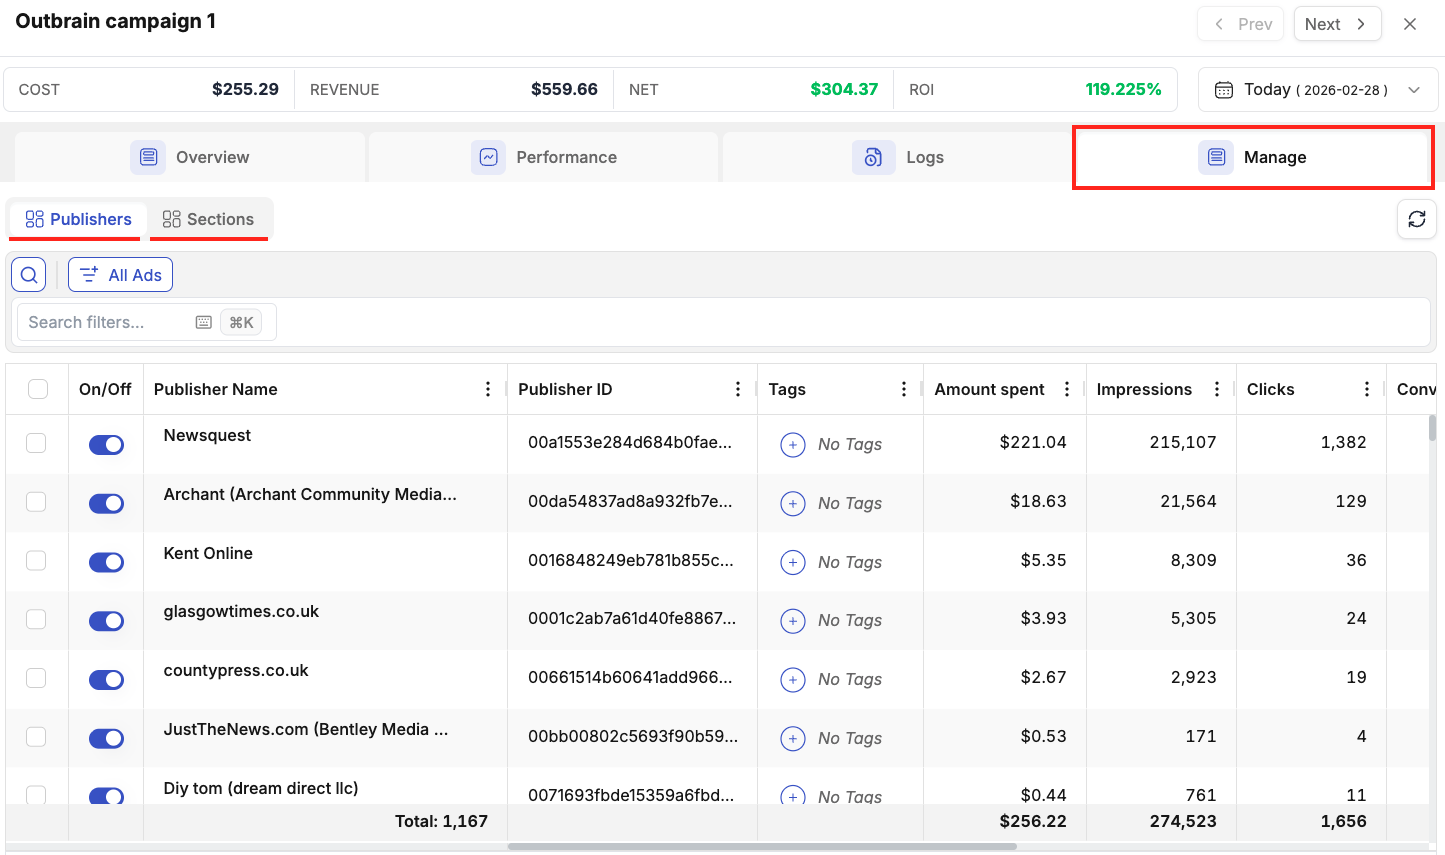
For native traffic sources, an additional tab called Manage appears at the campaign level that provides a placement-level performance breakdown.
These tabs are the equivalent of the "Sites" or "Publisher" reporting you would find in the native Taboola or Outbrain dashboards, brought directly into the Details View for the campaign you are reviewing.
For example:
- Taboola → Manage Tab — shows performance broken down by individual publisher site. Use this to identify which sites are driving results and which are wasting spend. From this view you can pause underperforming sites directly without navigating away.
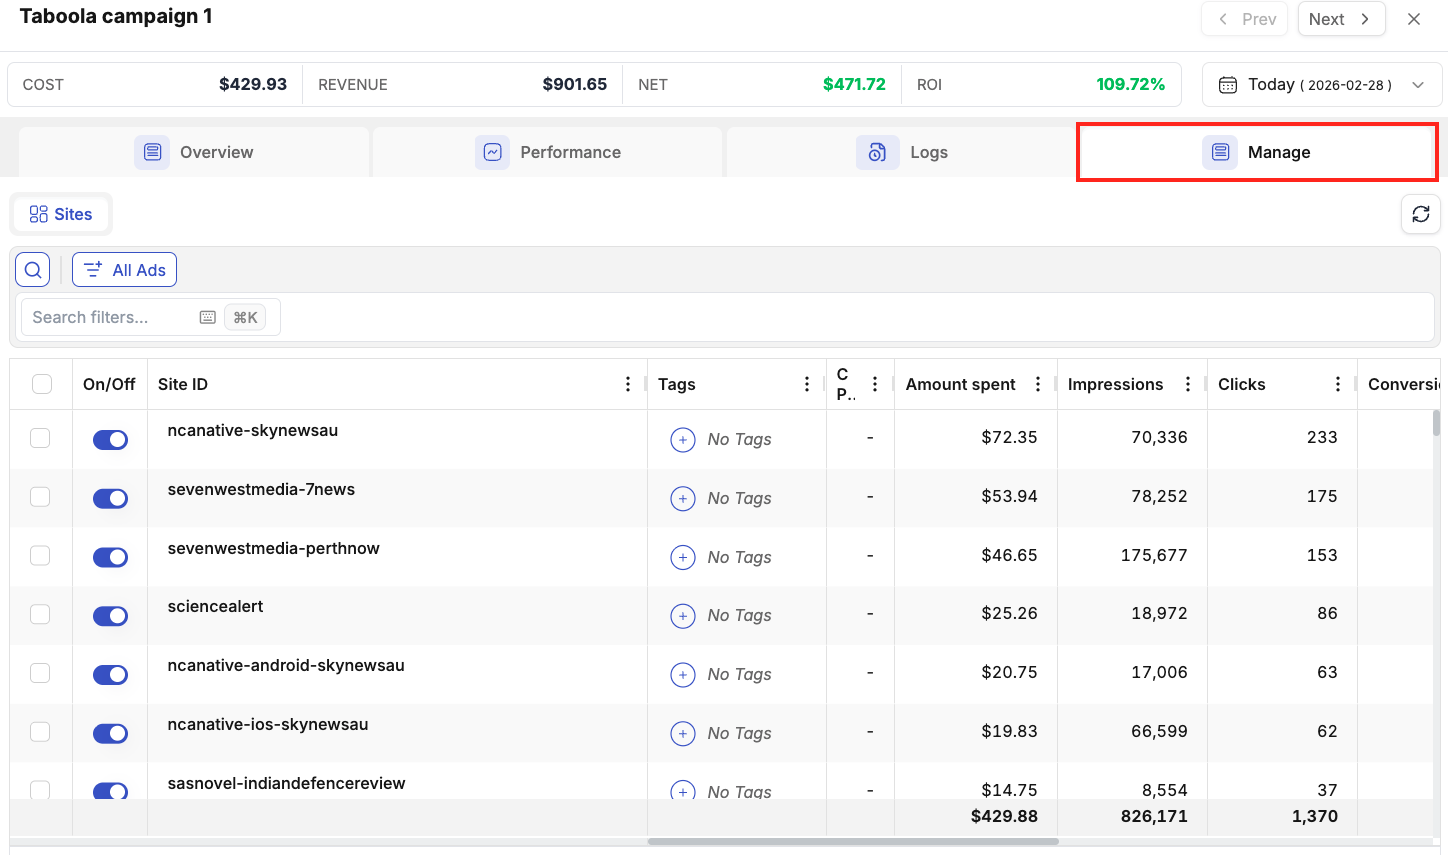
- Outbrain → Manage Tab — shows performance breakdown by publisher and by section within each publisher. Use this to identify which publishers or sections are driving results and which are wasting spend. From this view you can pause underperforming publishers or sections directly without navigating away.
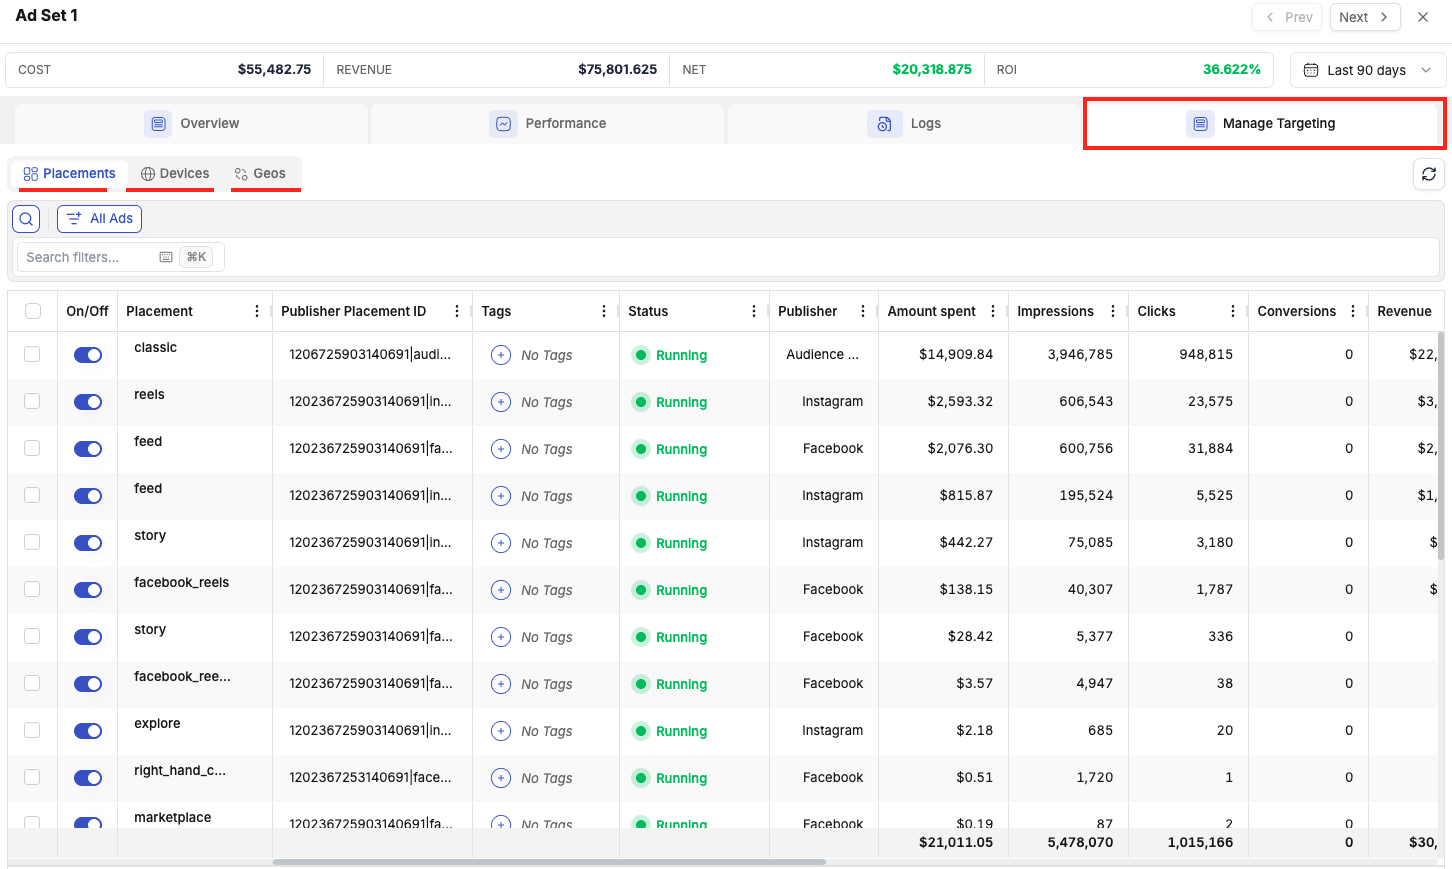
Facebook — Ad Set Level: Manage Tab
When you open the Details View for a Facebook ad set (not campaign), an additional Manage Targeting tab appears. It contains three sub-breakdowns:
| Sub-tab | What it shows |
|---|---|
| Placement | Performance by ad placement (Facebook Feed, Instagram Stories, Audience Network, etc.) |
| Device | Performance split by device type (Mobile, Desktop, Tablet) |
| Geo | Performance by targeted geography |
For each dimension you can review the performance data and then exclude specific placements, devices, or geos from the ad set's targeting — directly from within TheOptimizer, without going into Facebook Ads Manager.
💡 Tip: Run a placement breakdown on your best-performing Facebook ad sets to identify if a single placement (e.g., Facebook Feed) is driving all results while others (e.g., Audience Network) consume budget without converting. Excluding poor placements at the ad set level is a fast, impactful optimisation move.
5. Column Settings
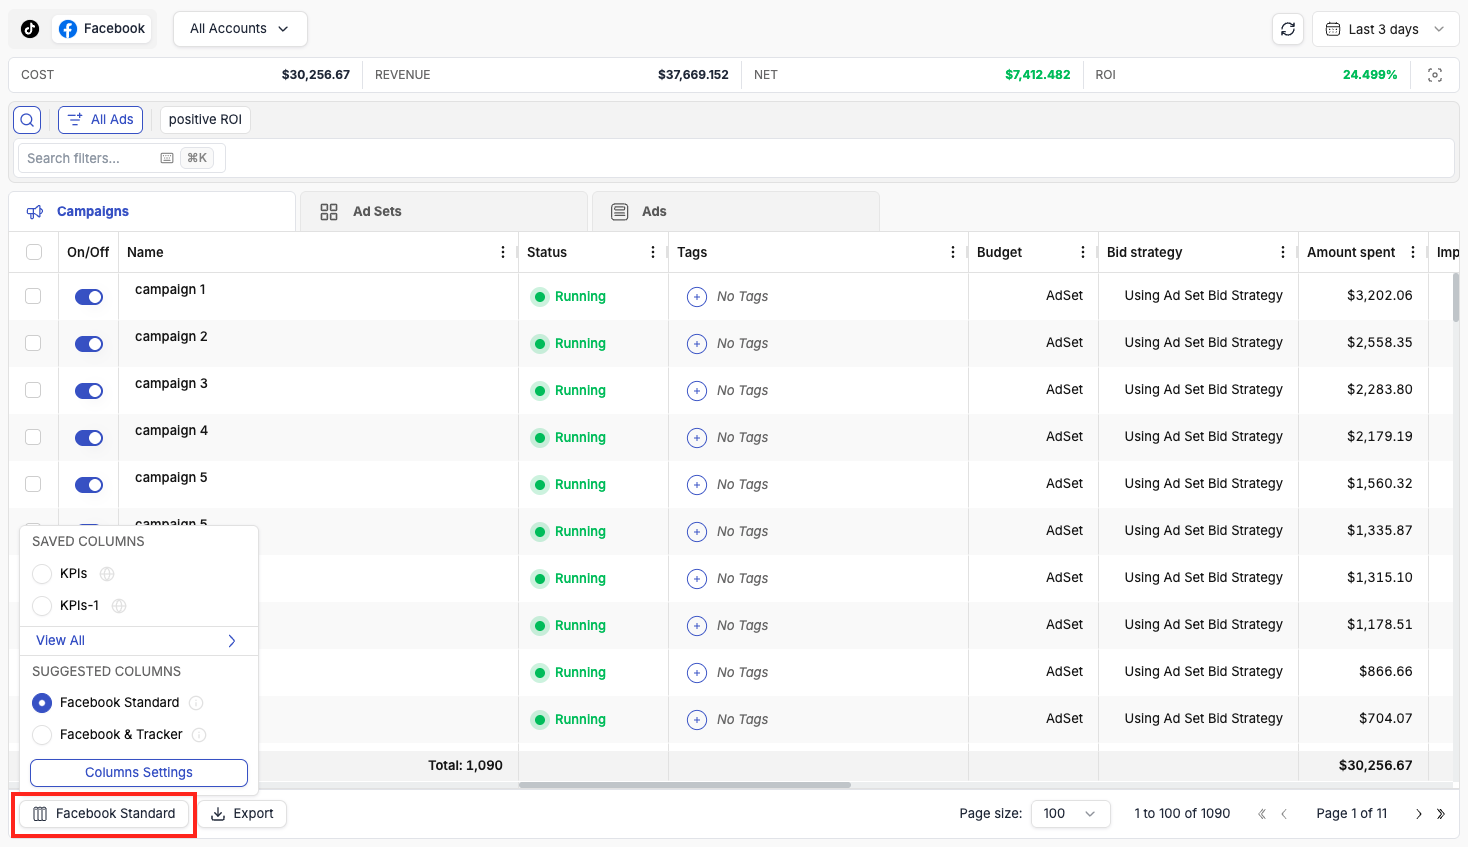
The column settings panel is located at the bottom-left corner of the table. Click it to open the Column Management dialog, where you can control which columns are visible, their order, and create your own custom column presets.
Default Column Views
TheOptimizer provides ready-made column presets for each ad network. For Facebook, for example, you will find:
- Facebook Standard — the essential Facebook ad network metrics only (no tracker data). This is a clean, focused view when you want to see native Facebook performance without additional columns.
- Facebook + Tracker — a combined view that merges the most important Facebook metrics with key tracker metrics side by side. This preset is only shown when you have a tracker connected.
These default presets cannot be deleted, and they are a good starting point for building your own views.
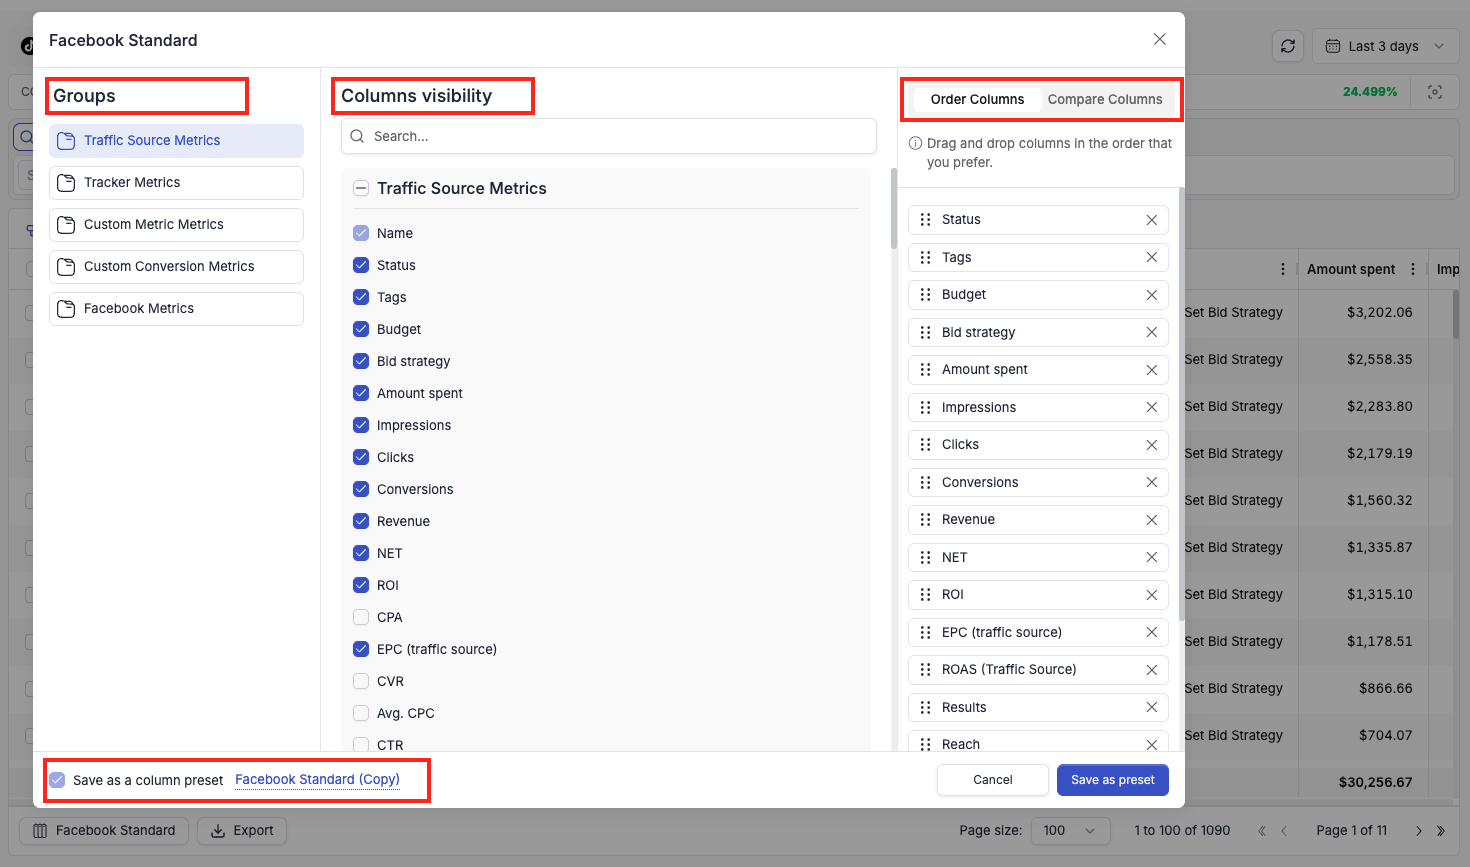
Creating Custom Column Views
To create your own column view:
- Open the Column Management dialog (bottom-left of the table).
- Use the left panel to browse column groups: Traffic Source Metrics, Tracker Metrics, Custom Metric, Custom Conversion Metrics, Search Feed Metrics, and network-specific groups (e.g., Facebook Metrics, AssertiveYield Metrics).
- Check or uncheck columns in the centre panel to show or hide them.
- Use the Order Columns panel on the right to drag and reorder the columns exactly as you want them.
- Any modification to a default view automatically prompts you to Save as preset under a new name.
- Your saved custom views appear at the top of the column view list and can be switched between at any time.
💡 Tip: Create different column presets for different workflows — for example, a "Daily Review" preset with spend, CPA, and ROI, and a separate "Creative Testing" preset focused on CTR, CPM, and click-through rate.
Custom Metrics
If the metrics TheOptimizer provides by default do not cover something you track, you can define up to 10 custom metrics using your own formulas.
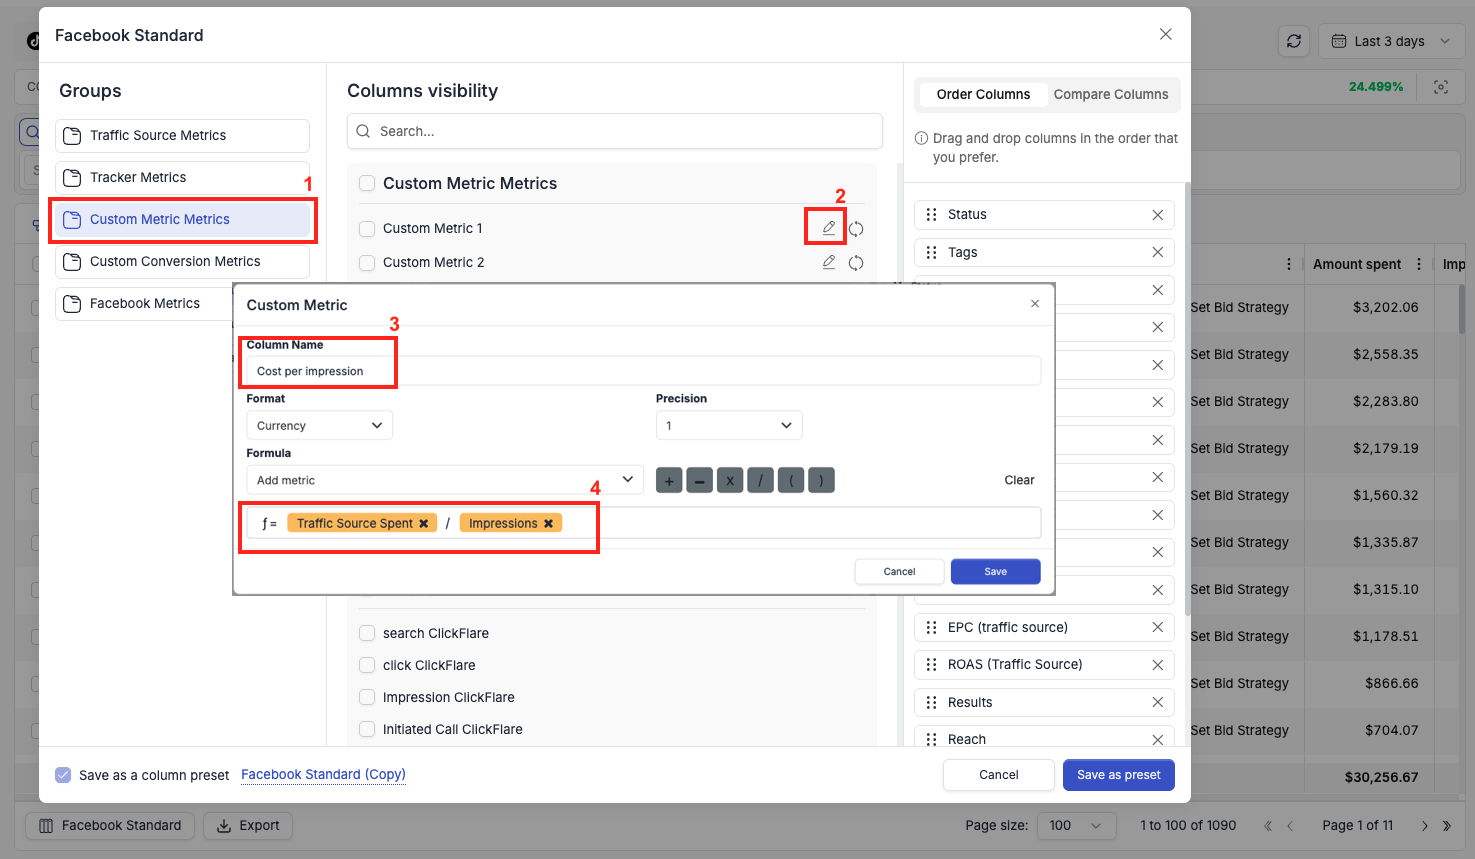
To create a custom metric:
- Open the Column Management dialog.
- Click Custom Metric in the left panel.
- You will see a list of 10 custom metric slots. Click the edit icon next to any empty slot.
- Enter a Column Name for the metric.
- Select the Format: choose Currency for monetary values or Percentage for rate-based metrics.
- Set the Precision (number of decimal places to display).
- Build your Formula using the formula builder: select metrics from the dropdown and combine them using the
+,−,×,/,(,)operators. - Click Save.
Your custom metric immediately becomes available as a column to add to any column preset, and also appears as an available metric inside your automation rules.
⚠️ Note: Custom metrics are available across all ad networks — not just the one you created them on. Make sure your formula references metrics that exist for each network you plan to use the column with.
Compare Columns
The Compare Columns tab inside the Column Management dialog controls which metrics show comparison data when the Compare Dates feature is active.
To set up compare columns:
- Open the Column Management dialog.
- Switch to the Compare Columns tab (top right of the dialog).
- Select the metrics you want to see side-by-side comparison data for (e.g., Amount Spent, Revenue, Conversions).
- Click Save as preset.
Once set up, when you activate Compare Dates in the date picker (Section 4), each selected compare column will display an additional column in the table showing the value for the comparison period. This makes it easy to see at a glance whether spend went up, conversions dropped, or ROI improved between the two periods.
6. Exporting Data
The Export button is located at the bottom of the main table, next to the column settings. It exports all data currently visible in the table to a file.
- If no filters are applied, the export includes all campaigns, ad sets, or ads for the selected ad network and date range.
- If filters are active, the export includes only the filtered results.
- The export respects the currently visible columns — only the columns shown in your active column preset are included.
💡 Tip: Apply your filters first to narrow down exactly what you need, then export — this keeps your export clean and ready to use without further editing.
Summary
The Campaigns section is designed to give you a single, efficient workspace that replaces the need to log into multiple native ad managers. Key capabilities to keep in mind:
- Cross-account visibility — view and manage campaigns, ad sets, and ads across all connected accounts in one table.
- Flexible filtering with saved views — build filter combinations once, save them, and access them with a single click.
- Keyboard-first design — the entire view from filtering to table navigation to editing can be operated without a mouse.
- Custom columns and metrics — tailor exactly what data you see and create new metrics with your own formulas.
- Details View for deep dives — move through items one by one with full audit trails, performance breakdowns, and rule management without leaving the panel.
- Traffic source-specific tabs — platform-native optimisation dimensions (sites, placements, geos) are surfaced directly inside TheOptimizer.